Practice in Asking Questions: Initiating Question Formation
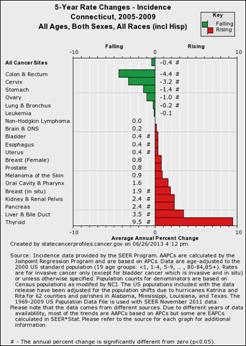
As an example of a classroom approach to the process of generating questions in statistics we will look at a health topic. Initially we will examine a graph as a framing device. Students will work in groups to examine the graph and eventually generate questions on topic. A questionnaire is useful in helping to unpack the visual density of the graph.
http://seer.cancer.gov/faststats/
Student group questionnaire:
What measure is on the x-axis?
What measure is on the y-axis?
Which type of cancer has increased the most in this five-year period?
Which type of cancer has decreased the most in this five-year period?
Interpret the red bar with the 1.6 label to its left.
What questions do you have after looking at this graph? List all you can imagine.