Climate Change Status and Projections
Average global surface temperatures have risen an estimated 0.94°C to 14.84°C in 2016 compared to the 20th century average
3
. Most of this change is attributable to an estimated 0.17° Celsius increase per decade since 1970
3
. Arguments have been made that certain areas of the world may be warming while others are cooling, however, the National Aeronautics and Space Administration (NASA) has collected comprehensive data from all across the globe.
Figure 1
below, which shows 2016 surface temperatures compared the average temperatures between 1981 and 2010, indicates a strong warming trend in most areas of the globe.
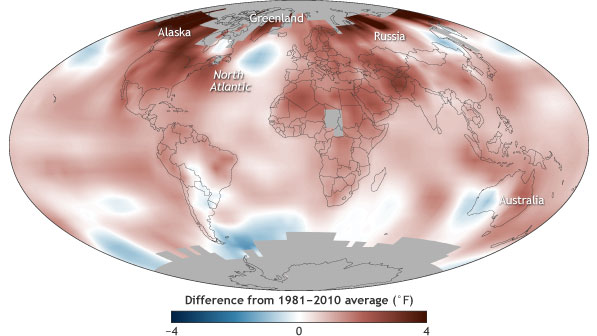
Figure 1: Average surface temperature in 2016 compared to the 1981-2010 average. NOAA Climate.gov map, adapted from Plate 2.1a in State of the Climate in 2016
3
.
The Intergovernmental Panel on Climate Change’s (IPCC) 2013 “Mitigation of Climate Change” documents four possible scenarios of emissions and the consequences of those scenarios in terms of average surface temperatures as far as year 2200
4
. These four scenarios are referred to Representative Concentration Pathways (RCPs), RCP2.6, RCP4.5, RCP6.0, and RCP8.5. Projections suggest that global temperature changes must remain below a 2° Celsius increase relative to pre-industrial levels by year 2100 in order to avoid many of the dangers associated with climate change
5
. RCP2.6 is the only scenario in which global temperatures stabilize and remain below a 2°C increase. In order to achieve this scenario we must reduce CO
2
eq emissions by 78-118% between 2010 and 2100, meaning that we must all but eliminate emissions or possibly even achieve a negative carbon emission rate
5
(Atmospheric CO
2
eq refers to a collection of gases that contribute to the greenhouse effect, which will be explained in more detail below.). In worse case scenarios such as RCP8.5 there could be increases in global temperatures of 4.8°C relative to pre-industrial times.
Figure 2
below illustrates average global temperatures at three different points within the four possible emission scenarios
4
.
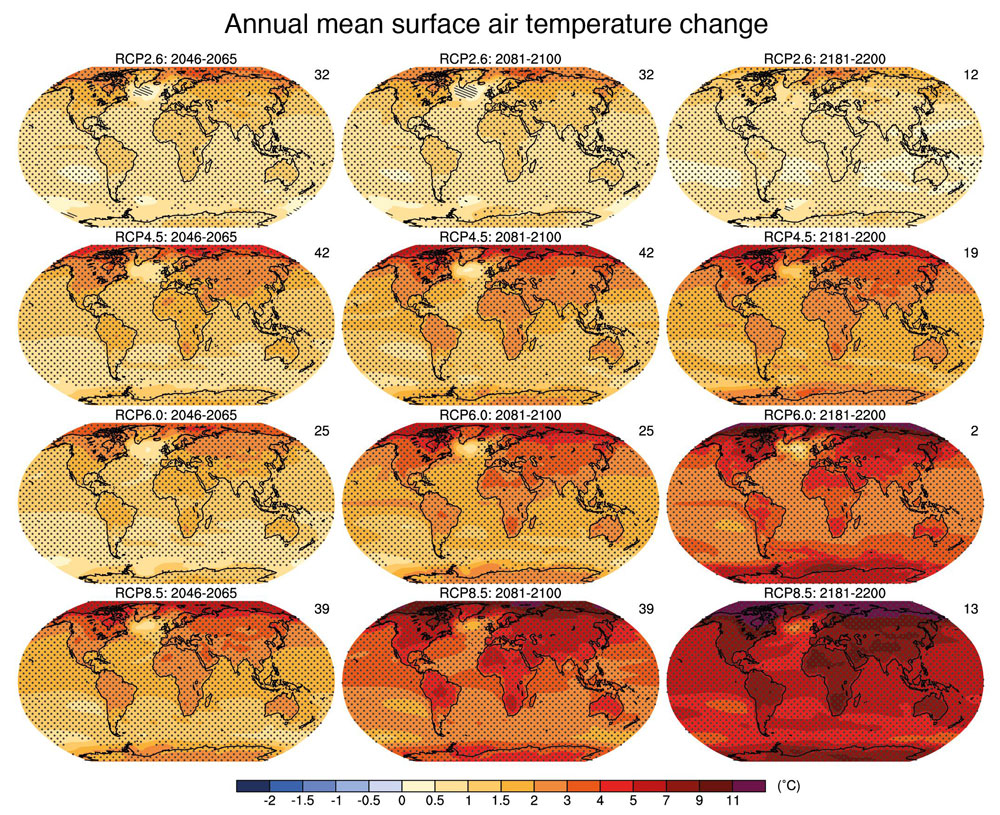
Figure 2: Projected changes in global average temperatures under four emissions pathways (rows) for three different time periods (columns). Changes in temperatures are relative to 1986-2005 averages. The pathways come from the IPCC Fifth Assessment Report: RCP2.6 is a very low emissions pathway, RCP4.5 is a medium emissions pathway, RCP6.0 is a medium-high emissions pathway, and RCP8.5 is the high emissions pathway (emissions are assumed to continue increasing throughout the century). Source: IPCC, 2013
4
.
Implications
In 2006, Hansen et al. predicted that a rise in global average temperatures of approximately 1° C or more compared to temperatures in the year 2000 could result in dangerous effects in regard to sea level rises and decreases in the populations of certain biological species due to habitat loss and other stressors
6
. For all four of the emissions scenarios, global sea levels are projected to rise. Estimates range from an increase of 0.26 meters to 0.98 meters by 2100 depending on the emission scenario
4
. For humans the major issue of climate change likely won’t be loss of life, but rather tremendous economic consequences. Rising sea levels could result in damage to property and infrastructure including homes, roads, bridges, railroads, etc. Increased agriculture drought world-wide is likely by 2100 in dry-climate areas with the higher emission scenarios
5
. This could lower crop yield and force more economic strain. It is estimated that 343 to 385 billion United States Dollars (USD) need to be invested globally each year over the next 20 years to stabilize atmospheric carbon dioxide equivalents (CO
2
eq) concentrations to 430-530 parts per million (ppm)
5
.
Mechanism
The greenhouse effect is the result of gases in the atmosphere trapping some of the sun's heat energy on Earth. The sun emits shorter wavelength radiation, which is absorbed by the Earth, In turn, Earth then readmits longer wavelength energy in the form of infrared radiation. Some of this infrared energy is absorbed by atmospheric greenhouse gasses (GHG) and essentially “trapped”.
The quality that gives greenhouse gases their name is the ability to absorb infrared radiation. Nitrogen and Oxygen gases, the most common gases in the atmosphere, for example do not absorb infrared radiation. Carbon dioxide, methane, water vapor, and other greenhouses more efficiently absorb infrared radiation.
There are many gases that contribute to greenhouse effect, emitted both naturally and because of human activity. However, gases have significantly different abilities to reflect infrared radiation and trap heat within Earth’s atmosphere. For instance, methane (CH
4
) is estimated to have 25 times the potency as a greenhouse gas as carbon dioxide
4
. The potency of a greenhouse gas is measured by a unit called Global Warming Potential (GWP). The GWP of gas is calculated using
Equation 1
below.
Equation 1: Global Warming Potential
GWP of gas A = energy absorbed by 1 ton of gas A / energy absorbedby 1 ton of CO
2
Consequently, 1 ton of CH
4
is estimated to absorb 25 times the energy as 1 ton of CO
2
. For simplicity, scientists convert the effect of each individual greenhouse gas into CO
2
equivalents (CO
2
eq). Methane, for example, was thought to contribute 16% of the anthropogenic GHG effect in 2010 compared to 65% from CO
2
5
. Therefore, CO
2
had a 4.06 times stronger of an impact than CH
4
, however, because CH
4
has 25 times the GHG potency there was actually approximately 102 times more CO
2
molecules emitted from human causes in 2010 than CH
4
molecules. Interestingly, water vapor is thought to contribute the greatest to the greenhouse effect attributing for an estimated 60% of the natural greenhouse effect
7
. However, since water vapor concentrations are not increasing due to emissions it is not thought to be significantly contributing to climate change.
Human Impact and Response
Considering the data discussed above, scientists are highly confident that our activities as humans are responsible for a significant portion of climate change. If we are to avoid significant rises in temperatures and the subsequent implications, efforts must be made to reduce our emissions. One possible strategy to lower human-driven GHG emissions is a carbon tax; a tax on how much CO
2
eq emitted by an individual, family, or organization to disincentivise wasteful activities and use of fossil fuels. Several states have seriously considered carbon taxes including Washington, Oregon, New York, Massachusetts, Vermont and Colorado. The city of Boulder, Colorado implemented the first city-wide carbon tax in 2007 charging $7 for every ton carbon dioxide produced. Estimates suggest that this tax cost the average household $1.30 per month. At the time of implementation the city estimated this tax would bring in revenue of approximately 1 million dollars each year, although this amount has likely increased after a rate increase on the carbon tax in 2009. Several states who have discussed carbon taxes have suggested redistributing the funds raised to lower corporate and personal income taxes.
In order to achieve the RCP2.6 emission scenario and stabilize temperatures must be reduced to at or near zero. Unfortunately, policy changes such as the carbon tax alone is not enough to accomplish this task. New technologies must be discovered or simply expanded in order to remove the need for GHG-emitting energy sources and enable policies that have the goal of reducing GHG emissions.
Alternative Energies
There are a number of energy sources besides fossil fuels that may potentially benefit our environment by reducing carbon emissions. Most of the focus for accomplishing this goal are on renewable resources that do not deplete or can be replenished within a normal lifetime. The majority of alternative energies still use the same turbine-powered generator design that typical fossil fuel power plants employ. This generic design is illustrated below using a coal plant in
Figure 3
.
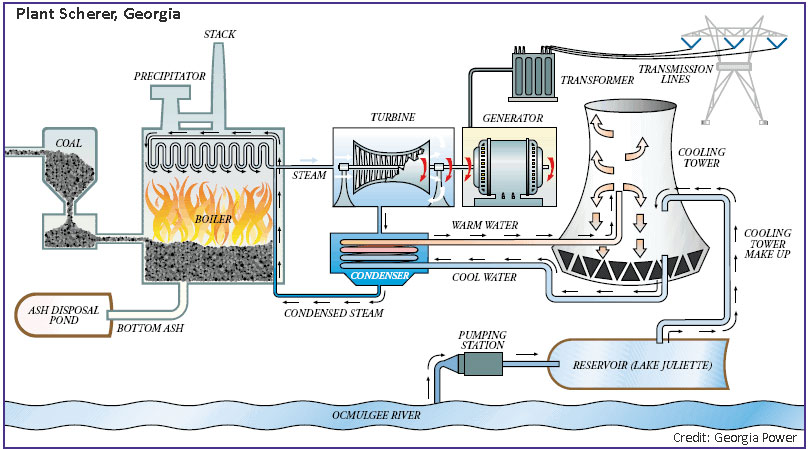
Figure 3: Basic design of a coal power plant
Fossil fuel, biofuel, nuclear, and geothermal power plants all use the same premise. There is a combustion chamber used to burn the fuel and use the heat to produce steam from water (except for geothermal plants which directly harvest steam from the ground). This steam rises and travels to spin a turbine. The spinning turbine powers a generator and the electricity created is regulated with a transformer and sent out via power lines. The steam eventually condenses and is recycled. In the above system, coal or other fossil fuels can be replaced by biofuels. Concentrated solar power is another technology that uses this method by using mirrors and lenses to concentrate solar energy into a smaller area. The heat created powers a steam engine as described above. Marine, hydro, and wind power also use very similar systems. Wave power plants use the air compressed by the movement of the water within a closed system to spin a turbine instead of using steam. Water moving in and out of a tidal barrage in a bay is used to spin a turbine underwater in a tidal power plant. Hydropower plants use essentially the same system but with a river, a dam, and gravity instead of the tides. Wind power in some ways seems the most elegant with the turbine as the most prominent feature and wind as the energy source. The only prominent energy source that does not require a generator is photovoltaic solar. Silicon-based solar cells directly harness direct current (DC) by allowing photons from sunlight to knock electrons free from the silicon atoms. The DC is then converted to alternating current (AC) before entering the home to be used.
A simple but important way of analyzing the environmental impact of an energy source is to calculate its emission factor. In respect to alternative energies, the emission factor can be calculated as the amount of CO
2
eq released per unit of energy produced. This can be expressed as the grams of CO
2
eq (gCO
2
eq) released from burning enough coal to produce one megajoule (MJ) of electricity. The emission factor of natural gas, for example, is approximately 51 gCO
2
eq/MJ
8
. However, this statistic is limited in what it tells us, not accounting for the energy invested in a system before it is operational. The emission factor for solar is theoretically 0 gCO
2
eq/MJ but this tells us little of its environmental impact on the whole.
Embedded or embodied energy is the energy required to make and maintain any given product or system. Any product that is manufactured is likely to have some amount of embodied energy, thus considering embodied energy when examining the efficiency of an alternative energy is important. Early solar panels for example, had a marginal benefit over fossil fuels in terms of their environmental impact because of their still modest efficiency in harnessing the power of the sun and high embedded energy for manufacturing panels.
As an example, the energy required for the production and maintenance of the different parts of solar panels is listed in the
Table 1
below
9
. Embodied energy is typically measured in megajoules per kilogram (MJ/kg), gigajoules per kilogram (GJ/kg), or tons of CO
2
per kilogram (tCO
2
/kg) but this analysis uses different units.
Table 1: Distribution of a solar panels embodied energy
9
|
Parts
|
Embodied Energy
|
|
Processing of silicon
|
460 kilowatt hours (kWh) per kilogram (kg)
|
|
Production of solar cells
|
120 kWh per square meter
|
|
Assembling the module of the panel
|
190 kWh per square meter
|
|
Construction materials to install panels
|
200-500 kWh per square meter
|
|
Miscellaneous parts
|
Varied
|
We can then calculate the payback period for the embodied energy using
Equation
2
:
Equation 2: Payback period
payback period = embodied engergy / energy output per time
The payback period of silicon-based solar panels is between 1.65 and 4.12 years depending on their efficiency
10
. This means that it will take 1.65-4.12 years of regular use before the panels have had a positive environmental impact compared to fossil fuels. With an expected lifespan of 25-30 years, this seems to be a fair investment. Though it is important to note the power outputs of panels does degrade slowly with age. Comparatively, wind turbines have a payback period of only several months with a lifespan of about 20 years
11
.
Nuclear energy, although not a renewable resource, is an energy source that some have suggested may help us meet high energy demands while also reducing greenhouse gas emissions. Arguments have been made that the CO
2
eq produced in the preparation of Uranium negates the effect of the energy produced in the nuclear plant, however, an analysis by Schneider et al. suggests that the energy used to produce Uranium represents only 1% of the energy plants are able to produce with it
12
. Nevertheless, arguments against nuclear power for being expensive, potentially dangerous and producing radioactive waste remain intact.
By some estimates hydropower has one of the best energy paybacks, meaning it has one of the highest ratios of energy output over its lifetime to the energy it requires to build, maintain, and fuel it
13
. However, some have suggested that the reservoirs of hydropower plants are responsible for more GHG emissions than previously thought and that projections of the technologies efficiency are inaccurate
14
. These artificial reservoirs contribute more GHG to the atmosphere compared to natural lakes from increased microbial decomposition because of the submerged plant matter and from “methane bubbling” because of higher variability in water levels. One interesting application of hydropower is the possibility for its use on the small scale (enough to power the basic operations of a small village of about 1,120 people) with a payback period of about 7 years
15
.
Payback periods of biomass power plants range greatly partially because of various different fuels able to be used but is estimated to be 12 to 46 years for a wood pellet plant depending on the rate of production the plant decides upon
16
. Geothermal also remains a potential large untapped source of energy with reportedly enough heat energy in the upper 5 kilometers of Earth’s crust to provide the entire world power supply (at its current demand) for over 200,000 years
17
. Current access to geothermal is limited to specific locations where heat is near the Earth’s surface.
Other technologies exist that are less commonly used or are not fully developed including examples such as microbial fuel cells (MFCs) and buoyant airborne turbines (BATs). BATs were developed by Altaeros Energies, a Massachusetts-based telecommunications and renewable resource company. The BATs are lifted about 2000 feet above the ground using a helium filled shell, acting essentially as a large balloon. The winds at these heights are stronger and more consistent allowing the BATs to be more efficient than traditional turbines. Because this technologies is on the fringe of engineering there have yet to be thorough analyses of the embodied energies or life-cycle emissions of BATs. Microbial fuel cells are another interesting candidate to help society meet its growing energy needs. MFCs work in a similar way to regular fuel cells except that they use bacteria as catalysts instead of platinum or nickel catalysts. The microbes sit on one electrode in an oxygen-free environment and produce electrons so long as they are provided with sufficient food substrate. These electrons travel to the other electrode where they can react with oxygen. This substrate is the fuel for MFC’s and industrial and domestic wastewater has commonly been used to fuel MFC’s. Those interested in harnessing the power of MFCs originally had hoped that they could simply scale up the size of the cells to increase output since this would be the most efficient option financially. Unfortunately, small MFCs were found to be much more efficient than larger cells
18
. This is likely due to the higher surface area-to-volume ratio of smaller cells. One environmental concern with MFCs is that one of the major raw materials used in the production of the electrodes is graphite, which has a high embodied energy. Despite this, estimates have been made that the payback period for MFCs are approximately 5 years when implemented at a small industrial scale
19
.
The payback period is a quite simple method of assessing a technology’s environmental friendliness but there are more thorough analyses such as the “life-cycle assessment” (LCA). Life-cycle assessments consider many different variables including emission factors, embodied energy, and waste materials when a system is at the end of its life. These analyses enable comprehensive, quantitative comparison among technologies.
Table 2
below lists the median estimated life-cycle emissions of various common energies. This data was compiled in a review of emissions studies
20
.
Table 2: Life-cycle emissions of various energy sources
20
.
|
Technology
|
Median emissions (gCO
2
eq/kWh)
|
|
Hydro
|
4
|
|
Wind
|
12
|
|
Nuclear
|
16
|
|
Concentrated solar
|
22
|
|
Geothermal
|
45
|
|
Photovoltaic solar
|
46
|
|
Biomass
|
230
|
|
Natural gas
|
469
|
|
Coal
|
1001
|
It is interesting to note the low LCA of concentrated solar energy compared to photovoltaic solar. The resources required to build a facility large enough to implement this technology likely limits its use.
From the evidence reviewed, hydropower and wind energy seem to be the most environmentally friendly, however, they have various limitations including cost and the availability of land with the proper terrain. In the case of hydropower, damming rivers changes ecosystems and this practice is now discouraged in the U.S. Solar energy offers a more convenient method for individual consumers but this is also costly, does not always supply the entirety of the energy need, and is not currently practical for all types of homes or in all regions. For this reason, a new technology to provide cheap, clean, and convenient energy to consumers is in great demand. Remembering to turn off all of the lights is not what will save the world; the innovation of a youthful mind will.
Student project
Engineers use math to make accurate preparations for building their technologies and make predictions of their efficiency. Even with intensive calculations engineers often make mistakes or overlook certain factors, which may have been prevented with more thorough preparation and thought. Scientists and engineers didn’t think it was possible for human beings to make a measurable difference in the ocean’s pH for example until we did. This sort of oversight is more likely to be prevented with adequate preparation and projection analysis. For this reason, students will be expected to demonstrate the efficiency of their technologies using several calculations. Students will calculate the payback period of their alternative energy after estimating the embodied energy and the energy outputs of their system. They may calculate the embodied energy using a tool such as the “Embodied energy and carbon footprint database” composed by the University of Bath
21
. Students will make an accurate calculation of their energy outputs after measuring the voltage and amperage of their model power plant and calculating the watts generated using the equation Watts (W) = Amps (A) x Volts (V). Students may scale up their numbers to calculate the estimated energy output of a life-size facility if they’d like but then they also need to scale up their embodied energy calculations.