Students will earn points in Activities 1-4 that they will use to “purchase” a test grade. Be sure to reiterate this to students as it will incentivize them to participate in each simulation as intended. It may be helpful to read Activity 5 first. It may also be motivating to tell students how many points they’ll need to earn an A. Don’t reveal that there are two different price menus yet.
Activity 1: Comparative Advantage
Sequencing and Objectives
This activity should be completed before studying comparative advantage. After the activity, students will be able to explain that not all resources are perfectly substitutable and that specialization maximizes productivity. Students will also be able to explain how comparative advantage led to the rise of gender disparity during the agrarian revolution.
Overview
The class will collect physical fitness data by measuring strength, speed, and stamina of male and female students. Be sure to announce the class before that students should dress appropriately and wear sneakers.
Directions
- Divide the class into five groups of approximately five students. Try to ensure that each team has approximately the same number of male and female students.
- Select 5 exercises: pushups, suicide sprints, squats, chin-ups, crunches, burpees, lunges. All teams must complete the same 5 exercises. I’d encourage you to collaborate with a physical education teacher. They’ll be more than excited to help!
- Each group must assign one person to each exercise. No person can do more than one exercise. If someone is physically unable to participate, allow them to record data. Encourage students to participate, reminding them that this is an economics experiment. Record who is assigned to each exercise.
- Have students complete their exercises and record their reps. To save time, students can do this at home for homework.
- Total each teams reps. The team with the most reps wins. The winning team will earn 100 points toward Activity 5. Other teams will earn 90, 80, 70, or 60 points, respectively. I’d recommend keeping a log of all the activities’ results as they will be referenced in Activity 5.
Discussion Questions
After completing the exercises, return to the classroom and have students record the data for each exercise on the board. They should record the student’s name and the number of reps completed. Ask groups to write down discussion questions based on their observations. Begin class discussion with the student generated questions. Below is a list of additional guiding questions. Depending on time, you can do large group discussions or think-pair-shares.
- What observations can you make about the data? Do any gender patterns exist?
- How did you decide what people to put with each exercise? Was it because that student loves that exercise?
- How do you think the results would have differed if students were required to compete in their worst exercise instead of their best?
- How would your choices have changed if students were allowed to do more than one exercise?
- Are there any exercises that were exclusively (or primarily) completed by males or females? Why do you think this occurred?
Mini-Lesson
Teach a mini-lesson on opportunity cost and comparative advantage. Use the following example as a guide. Note that the following is an example of an input question. The numbers in the table represent how many people are required to either plow the field or complete domestic work.
|
Men
|
Women
|
|
Plowing Fields
|
10
|
15
|
|
Domestic Work
|
5
|
5
|
AP-style free response question:
- Calculate the opportunity cost for men to complete domestic work. [A: 1/2 fields]
- Calculate the opportunity cost for women to plow fields. [A: 3 domestic works]
- Who has a comparative advantage in plowing fields? Explain your answer. [A: Men, because their opportunity cost = 2 domestic works whereas women’s is 3]
- Assume technology improvements decrease the number of men required to plow fields to 5 and the number of women required to plow fields to 5. Who should specialize in plowing fields? Explain your answer. [A: Neither, no one would have a comparative advantage because their opportunity costs would be the same=1 domestic work]
Guiding questions for discussion on gender inequality:
- How did the concept of comparative advantage promote gender roles during agrarian times?
- What about the agrarian revolution facilitated gender specialization?
- What types of work do people engage in during post-industrial times? In America?
- Is gender specialization necessary in the post-industrial world? Why or why not?
Activity 2
Sequencing and Objectives
This activity should be completed before studying oligopoly and game theory. After the activity, students will be able to determine if a dominant strategy exists, how to find Nash equilibrium, and determine if a pareto improvement exists. Students will understand how multiple iterations of a game impacts strategies earlier and later in the game. Finally, students will be able to explain how marriage decisions mirror game theory strategies, discouraging women from working so men can maintain greater bargaining power within the relationship.
Overview
This activity is based on the game show “Friend or Foe?” and introduces students to decision making using game theory. Students will work in teams of two to answer AP-style multiple choice questions. Students will play 4 rounds with 5 questions each. Each correct answer is worth 20 points. At the end of each round, teams must decide how to split the points they just earned. Students will be allowed to talk to one another during rounds 1 and 3, but not allowed during rounds 2 and 4. You can use any topics you’ve taught prior to this as source material for review questions. I’d recommend pulling questions from past exams or from the College Board question bank.
Directions
- Make decisions cards that say “Friend” or “Foe.” Each student will need one set of these cards.
- Divide students into teams of two. Teams must sit together so they can collaboratively answer questions. Remind students that they will use these points during Activity 5 to “buy” their grade.
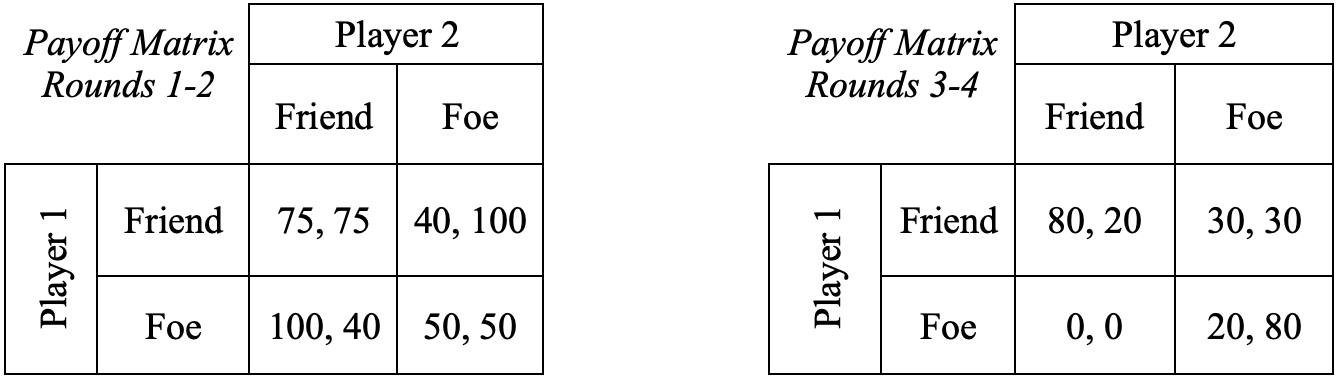
- At the end of each round, display the round’s payoff matrix, seen below. The values in the matrix represent what percentage of the team’s points that student will receive. Note that the percentages in each cell do not necessarily add to 100%. Give teams 3 minutes to analyze the payoff matrix and make a decision. Students may discuss their strategies with one another during rounds 1 and 3, but are prohibited from collaborating during rounds 2 and 4. [There is a dominant strategy for both players to choose Foe in matrix 1 and a dominant strategy for player 1 is to choose Friend, while player 2 chooses Foe in matrix 2.]
- After 3 minutes, separate the team members and ask them to secretly choose Friend or Foe. Collect their decision cards. Be sure their names are on the backs.
- Reveal each team’s decisions before proceeding to the next round. This is necessary as it will affect trust in future rounds. Record how many points each player receives.
- Complete three more rounds. Remember students are not allowed to collaborate in rounds 2 and 4.
Discussion Questions
After completing the four rounds, ask students to reflect on the following questions in their teams. Ask teams to develop 1-2 additional questions they would like to ask a specific team or the class as a whole based on their observations from the game. Give teams 5 minutes to discuss and then open discussion to the entire class.
- How did you decide what to do? Is it solely based on trust?
- How did the two different payoff matrices affect your strategy?
- Did you and your partner act rationally? Did you always select a strategy that would maximize your benefit? Why or why not? If you chose to act irrationally with regards to points, what were you valuing more than points?
- Consider matrix 2. Assume two players decide to reward one player each round so benefit is maximized (both choose Friend in one round and both choose Foe in the other round). In doing so, both players get 80% of the points in one round and 20% of the points in the other round. Does it matter who benefits first? Explain.
- If you’re going to betray your partner, when is the best time and why? Why not at other times?
Mini-Lesson
Teach a mini-lesson on oligopoly and game theory. Start with the classic Prisoner’s Dilemma to review the concepts of dominant strategy, Nash equilibrium, and pareto improvement. Then, use the “Battle of the Sexes” game as an extension. The first value in each cell represents the husband’s utility while the second represents the wife’s.
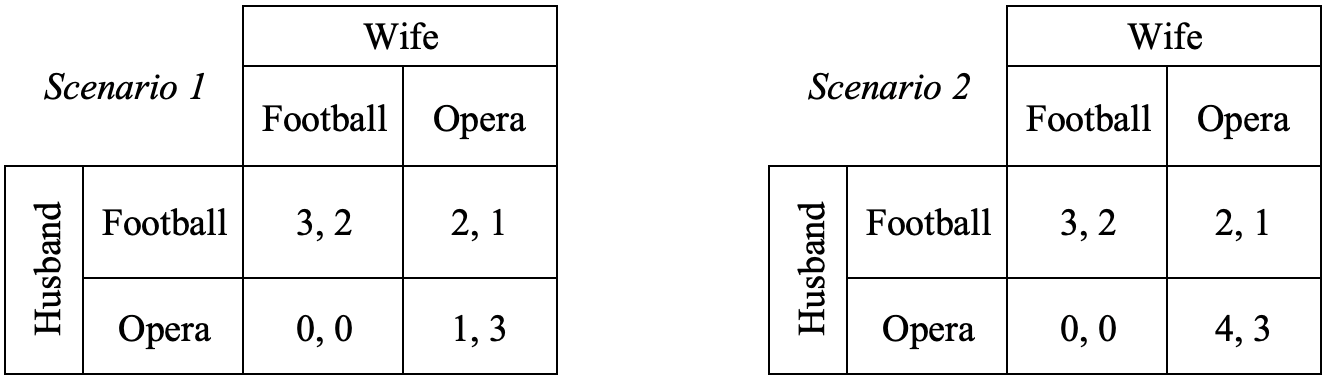
In these scenarios, a husband and wife must decide whether to watch a football game or go to the opera. The husband favors football over opera and the wife favors opera over football. Each benefits from doing their preferred activity alone. In Scenario 2, the wife tells her husband that if he chooses to go to the opera with her, she will make it up to him later, increasing his utility from 1 to 4.
AP-style free response question:
- Consider Scenario 1.
- If the husband chooses football, what will the wife choose?
- Identify the Nash equilibrium or equilibria actions for this game.
- Consider Scenario 2.
- Does the husband have a dominant strategy? Explain.
- Identify the Nash equilibrium or equilibria actions for this game.
Gender Inequality Prompts
Have students work in small groups to discuss Prompt 1. Have groups share their ideas and address any misconceptions or concerns before sharing the second prompt. If time permits, have students discuss in groups and then have groups share their ideas with the class. Alternatively, these prompts are very conceptual and would serve as a good thought exercise for homework. If used as homework, discuss students thoughts the next class.
Prompt 1
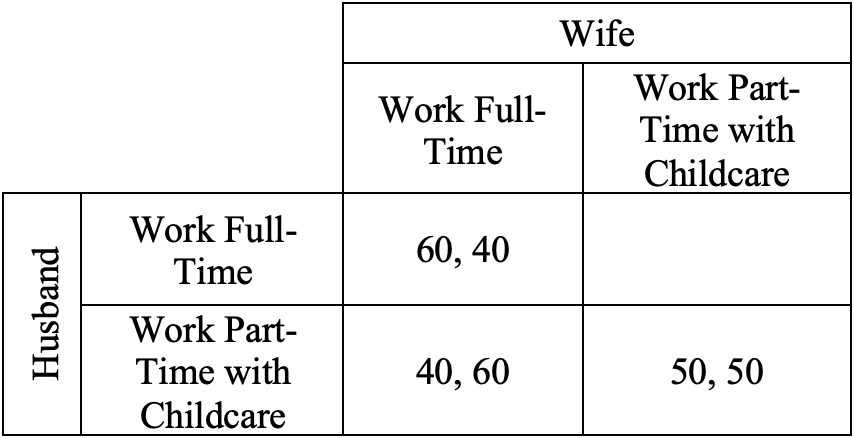
Economically a family is better off when both parents work. Their net income is higher and both the husband and wife can continue investing in human capital, further raising potential future income. Yet, Elissa Braunstein and Nancy Folbre suggest that husbands often encourage their wives to stay at home to take care of children because doing so increases their share of the wage surplus. Although the pie is smaller, the husband receives a larger slice.
Examine the partially completed payoff matrix below. Identify possible values for the blank cell that would result in a Nash equilibrium in which the husband works full-time and the wife works part-time and takes care of the children. [Sample Answer: 55, 45]
Prompt 2
Stephanie Coontz refutes the validity of the protective theory of marriage. This theory supports the notion of men as the provider and women as the caregivers and is the foundation for the “traditional” 1970’s view of marriage. Use your completed payoff matrix to explain why it is economically irrational for husbands to encourage their wives to stay at home to take care of the children.
[Sample Answer: There is always an economic incentive for wives to choose to work. In order for a wife to choose to work part-time, the husband must increase her share to the wage surplus above that of when she works (45% instead of 40%). This is economically irrational since the family income would be less and the husband’s share of the wage surplus would also be less. As Braunstein and Folbre suggest, if acting rationally, the husband would only choose to encourage his wife to not work full-time if doing so increased his share of the wage surplus. Therefore, any husband who does so is acting irrationally.]
Activity 3
Sequencing and Objectives
This activity should be completed after studying government intervention to market failure. The purpose of this activity is to gauge students’ tacit understanding of statistical discrimination in hiring practices. After the activity, students will be able to define statistical discrimination and will be able to identify efficient forms of government intervention that correct for market failure caused by statistical discrimination.
Overview
Students will answer a series of 5 prompts. Each prompt asks students to take on the role of a hiring manager and consider how gradually decreasing work hours impacts their hiring decisions. Afterward, the class will analyze the data to determine if the class shows statistical discrimination against hiring women.
Directions
- Create a Google Form with the five prompts listed below. Set a 2-minute timer for each prompt. The point of this timed survey is to gauge students' innate reactions without giving them much time to consider the underlying implications of their responses.
- Have students complete the Google Form on their own. This can be done for homework to save time.
- Project each prompt one at a time on the board. Give students 5 minutes to discuss each prompt with their tables and to come to consensus about an answer. Display the following discussion questions on the board in addition to the prompt.
- Who are you more likely to hire and why?
- What are the pros and cons of taking government-sponsored action from a production standpoint? Consider what you know about production and productivity.
- While students are discussing the prompts, access the student responses online and be prepared to project the results on the board after the discussion ends. Once prepped, circulate the room to listen to student discussion so you can create talking points or prep questions to push the students’ thinking.
- After students are done discussing each prompt, have groups share their final decisions with the class. Record these decisions on a piece of chart paper. The class will examine these results at the end of the discussion.
- Everyone earns 100 points toward Activity 5 for participating in the survey.
Prompt 1
- To what extent do you think that race plays a role in hiring practices?
- To what extent do you think that gender plays a role in hiring practices?
Prompt 2
You are the hiring manager of a company that makes widgets. Your employees work from 9 am to 5 pm with a paid 30-minute lunch break. Any additional breaks or time off is unpaid. Research shows that people are happier, healthier, and more productive when they get an hour break so the government decides to subsidize people who take 60-minute lunch breaks by providing them with a tax credit.
Assume that these two applicants are completely identical except in their choice of how long of a break they plan to take for lunch. On a scale of 1 to 10, with 1 being least likely and 10 being most likely, how likely are you to hire the following people?
- Carlos who plans to take a 30-minute lunch break
- Lisa who plans to take a 60-minute lunch break
Prompt 3
You are the hiring manager of a company that makes gizmos. Your employees work from 9 am to 5 pm and sign up biweekly to work five chosen days a week. Any additional days off are unpaid. Research shows that people are happier, healthier, and more productive when they work fewer hours so the government decides to subsidize people who work four days a week by providing them with a tax credit.
Assume that these two applicants are completely identical except in their choice of how many days a week they plan to work. On a scale of 1 to 10, with 1 being least likely and 10 being most likely, how likely are you to hire the following people?
- Lavon who plans to work 5 days a week
- Linny who plans to work 4 days a week
Prompt 4
You are the hiring manager of a company that makes whatsits. Your employees work from 9 am to 5 pm. Any additional days off are unpaid. Research shows that people are happier, healthier, and more productive when they receive maternity/paternity leave so the government decides to subsidize people who take maternity/paternity leave by providing them with a tax credit.
Assume that these two applicants are completely identical except in their choice whether they plan to take maternity or paternity leave. On a scale of 1 to 10, with 1 being least likely and 10 being most likely, how likely are you to hire the following people?
- Brian
- Maria
Prompt 5
You are the hiring manager of a company that makes whoseits. Your employees work from 9 am to 5 pm. Any additional days off are unpaid. Research shows that people are happier, healthier, and more productive when they receive maternity/paternity leave so the government decides to subsidize people who take maternity/paternity leave by providing them with a tax credit.
Assume that these three applicants are completely identical except in their choices of whether to take maternity or paternity leave and for how long. On a scale of 1 to 10, with 1 being least likely and 10 being most likely, how likely are you to hire the following people?
- Lianne who plans to take an extended maternity leave (two years)
- Lisbeth who plans to take a shorter maternity leave (six months)
- Elio who doesn’t plan to take paternity leave
Reveal Data and Class Discussion
Project the results of the individual responses on the board and have the group responses on chart paper displayed nearby. Below is a list of possible guiding questions. Use these questions plus any that you may have written down while listening to the students’ discussions to facilitate a discussion on statistical discrimination in hiring practices and ultimately to propose the prompt, “What can the government do to promote gender parity in the labor market?” Refer back to the content sections on temporal flexibility and childcare funding.
- Were student responses drastically different from one prompt to the next?
- How did individual responses differ when students were given more time to think about and discuss the implications?
- Did students lean more heavily toward hiring Brian than Maria in Prompt 3?
- What are the implications of maternity/paternity leave for a company?
- What does it mean about hiring practices that students were more likely to hire Elio in prompt 4?
- Does requiring companies to provide maternity and paternity leave help improve gender parity? Why or why not?
Activity 4
Sequencing and Objectives
This activity should be completed after studying government intervention to market failure but before studying inequality. The purpose of this activity is to illustrate the effects of the Pink Tax. After the activity, students will be able to explain that some laws are gender-biased and promote income inequality.
Overview
This activity is based on a game from the TV show The Price Is Right where contestants must guess the prices of various objects. Students will all be given the same basket of products to price with the exception of color. This experiment will determine if males underprice female-oriented products and if females overprice male-oriented products.
Directions
- Create two digital baskets of goods: a blue basket and a pink basket. Each basket should consist of disposable razors, deodorant, pens, a children’s bicycle helmet, a pair of jeans, a shirt, cologne, and a posture support brace. Images and prices for each of these products can be found online.88
- Divide the males into two equal groups (Groups A and B) and the females into two equal groups (Groups C and D).
- Groups A and C will price the blue basket. Groups B and D will price the pink basket. Groups A and D will serve as control groups. I hypothesize male students will have an easier time guessing the price of male versions of the goods while female students are more likely to correctly guess the price of female versions of the goods. Additionally, male students will underprice female versions and female students will overprice male versions due to their familiarity with the prices of their own-gendered versions of products.
- Calculate the average price differential per student. Students with an average differential of 25% or less will receive 100 points. Everyone else will receive 50 points.
Discussion Prompts
Once the data has been collected, share the data on the board. Share the results of each control and experimental group. Have students discuss their observations in groups. Below are sample discussion prompts to guide student discussion.
- What group was most likely to accurately price a good? Why?
- What group was most likely to underprice a good? Why?
- What group was most likely to overprice a good? Why?
- What’s the difference between the male and female versions of these products? What explains the price differential?
- What are the implications of this price difference between the blue and pink baskets?
Give groups 5 minutes to discuss the results before opening the discussion to the full class. Ask students to share their observations before introducing students to the idea of the Pink Tax. This can be a great discussion starter for the idea of the government’s role in the economy and the promotion of gender equality.
Activity 5
Sequencing and Objectives
This activity should be completed after Activities 1-4. The purpose of this activity is to expose students to the realities of the wage gap. After the activity, students will be able to explain the wage gap and its implications on income inequality.
Overview
Students will tally their points from Activities 1-4 and purchase a grade for the unit using their designated price menu. This exercise is meant to be highly unfair so as to highlight the injustices of the wage gap. It is also meant to help male students better empathize with the plight of their female peers.
Directions
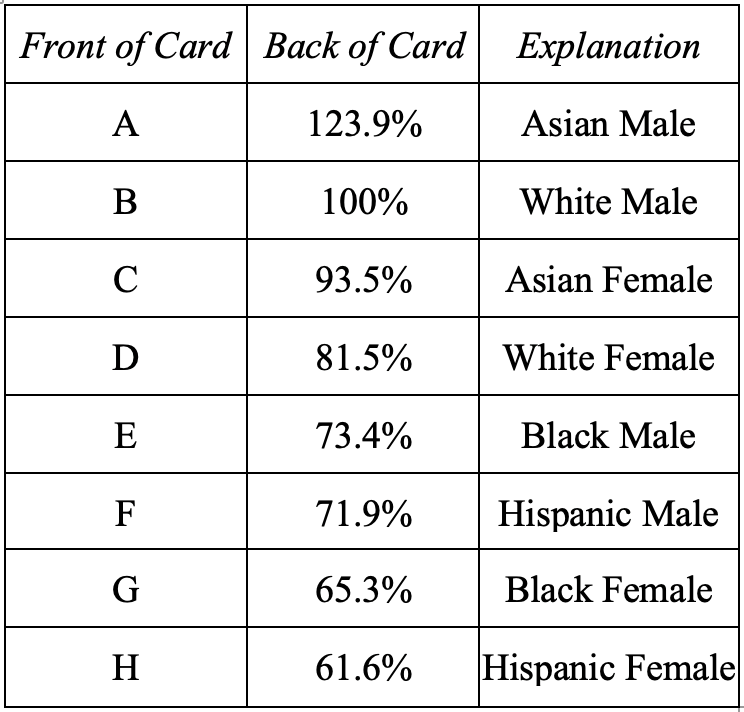
- Create eight different index cards labeled as follows. Make however many sets are necessary so every student will get one. Do not include the explanation on the card.
- Ask students to draw and keep one of the cards out of a bag.
- Reveal that you’ve been recording points for each of the activities students have participated in.
- Distribute a score report to each student with their team points for each activity.
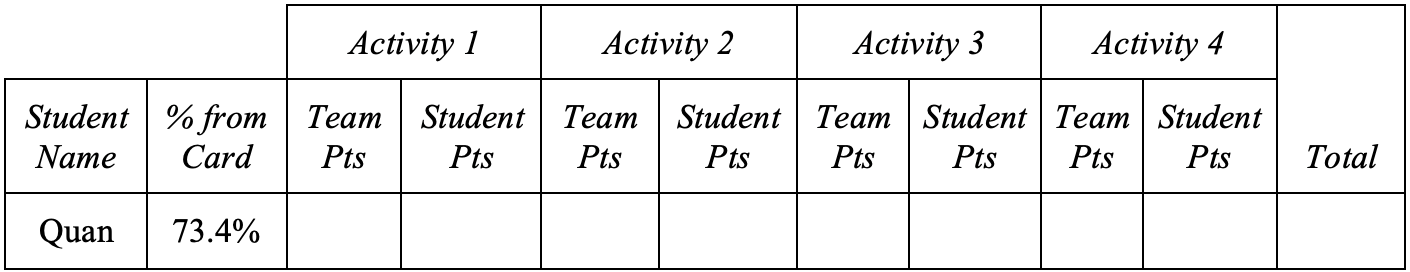
- Reveal that student points are based on the percentage from the card they just drew. Ask students to calculate their total points.
- Divide the board in three.
- On the left, order the students’ names based on team points, from highest to lowest.
- In the center, order the students’ names based on individual points, from highest to lowest.
- Display the following two grade menus on the board and explain that students will receive a test grade based on how many points they were able to earn from the various activities.
|
Price Menu for Letters A-D
|
Price Menu for Letters E-H
|
|
A: 600+
|
A: 625+
|
|
B: 500-599
|
B: 525-624
|
|
C: 400-499
|
C: 425-524
|
|
D: 300-399
|
D: 325-424
|
|
F: 0-299
|
F: 0-324
|
- On the right side of the board, order the students’ names based on test grade, from highest to lowest.
- Ask students to examine the data on the board. Ask if they have any questions or concerns about their grade and then watch the students explode with anger. Give students a couple minutes to complain and shout about injustice.
- When a sufficient amount of time has passed, ask students to look back at their salary cards. Reveal the race and gender represented by each card and identify that the percentage represents the average earnings of that worker as compared to a white man.
- Use the think-pair-share model to have students reflect on this simulation.
- Give students a couple minutes to collect their thoughts.
- Have students share their thoughts with those at their table
- Have groups share out their thoughts.
Guiding Questions for Group and Class Discussion
- What are their thoughts on this process?
- Was it fair? What exactly was unfair about it? Why is it unfair?
- Were any of the percentages surprising? Why or why not?
- Why do these wage differentials exist?
- What did the two grade menus represent?
- What can be done to improve wage equality?
Mini-Lesson
Reveal that students will not actually receive a test grade based on this unjust system. Facilitate a discussion on the economic implications of intersectionality and use it as a launching off point to talk about income inequality in the United States. When talking about the Gini Coefficient and the Lorenz Curve in Unit 6, return to this conversation on the intersectionality of race and gender. Refer back to the content section for relevant information to include in this mini-lesson.
Activity 6
The culminating project for this unit asks students to consider all that they’ve learned about economics and about gender disparity. Ask students to research the following.
- How the government intervenes (or how it could intervene) to diminish gender inequality in America
- How individuals can intervene to diminish gender inequality
- What community organizations exist that fight for gender equality
Students will earn an actual quiz grade for completing one of the following tasks. In both, students should discuss the systemic causes of the wage gap and what can be done to fix it.
- Write a letter to your state senator presenting your findings and advocating for political support of specific organizations that promote economic gender equality.
- Draft a proposal for how students at your school can get involved (e.g. volunteering at female-driven community organizations, organizing rallies, organizing fundraisers, etc.) to promote economic gender equality.