Sam H. Jones
Lesson 1
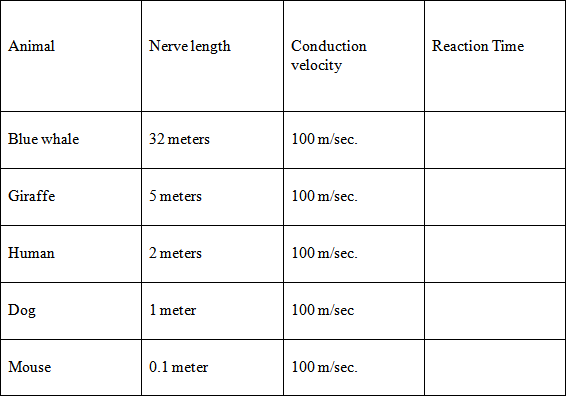
For this lesson idealized data will be used to study the reaction times of various animals, as well as humans. Reaction time is nerve conduction from the foot to the brain and back to the foot. The idealized universal conduction velocity will be 100 meters per second. The students will be given data such as the distance from the extremities to the cortex. For example, from the giraffe's toes to his brain is approximately 5 meters. From a mouse's toe to his brain is approximately 0.1 meters.

Begin the lesson with the question of which will have the quickest reaction time - a giraffe or a mouse? A human or a blue whale? Then have students complete the table remembering that the impulse must travel from the foot or tail to the cortex and back. Once the table is complete have students write and equation. Finally, have students graph their results.
Lesson 2
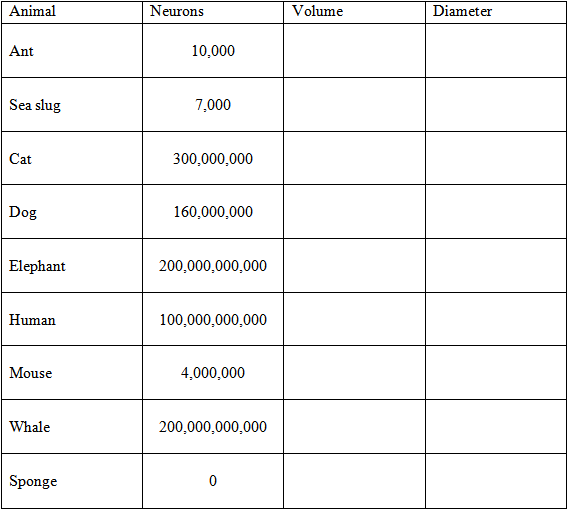
This lesson will use bags of marbles to represent neurons in the brain. Remind students of the formula for the volume of a sphere: V = (4/3)*Π*r
3
. Have about six different size bags - clear plastic bags work well - in order to show the differing amounts of marbles each bag will hold. Demonstrate the capacity of various bags. Alternatively you may have several students demonstrate this.
Using an average size of 50 micron diameter for each neuron, have students calculate brain volume and required diameter in the following table:

Lesson 3
For this activity I use an electronic keyboard and TI-83 or TI-84 graphing calculator. This especially motivates those students with a musical background. Many students have never realized the deep connection between music and mathematics.
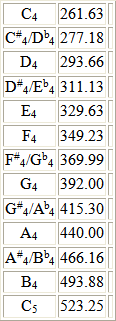
First, in order to determine the frequencies of each note in the tempered scale, we start with middle C, which has a frequency of 261.63. Each note up is calculated by the formula f
n
= f
0
* (2
1/12
)
n
which will produce the following table of frequencies:

Have a student, preferably one with a musical background, play several different chords, both consonant and dissonant. Also, have the student play the C major chord.
Using 2 as the amplitude have students insert frequencies for C, E, and G into the y= with each respective frequency in . Set windows on the calculator to y min -2.5, y max 2.5, x min 0, x max Π/265. Make sure students have set the calculators in radian mode.
Have students observe where the three graphs intersect. For C major, the graphs will intersect where C is 2 periods, E is 2.5 periods and G is 3 periods. Have students compare other chords.