Sam H. Jones
Harmony is a function of the relationship between the pitches of different tones either in sequence or sounded at the same time. Within these tonal contexts the pitches set up expectations as to what will come next. The skillful composer arranges these progressions to either meet or violate the listener's expectations for artistic purposes. (Levitin, 2006, p.17).
Jonah Lehrer (2006) suggests that Stravinsky understood, ahead of the science confirming it, that these expectations that we have are learned. If the listener's expectations are not met the piece may be considered disagreeable or discordant. In Rites of Spring Stravinsky violates many of the then current expectations and the work was initially considered discordant. Eventually the piece became accepted and well liked.
Daniel Levitin explains in his PBS show, The Music Instinct, that every object has the capacity to vibrate and make sound. Music is organized sound. When we hear music we are literally being touched and moved. The sound waves hit our eardrums and move the fluid in the cochlea against the hair cells which are laid out from low to high frequency. This is transmitted through the brain stem to the auditory cortex which is laid out in pitch order. It was previously thought that there was a music center in the brain. It is now believed that there are many parts of the brain involved, much like a neural orchestra. Different parts of the brain are affected by the different musical elements of pitch, timbre, tempo, harmony, and melody.
One apparent universal element of music worldwide is the octave. There also appears to be a certain predilection for consonance as opposed to dissonance. The elements of lullabies seem to be universal in the type of consonance that they have.
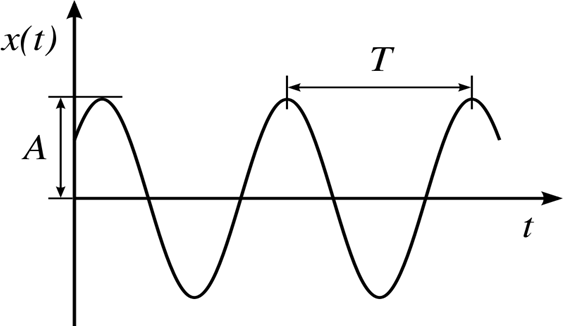
Dissonance and consonance may be graphed using sine waves. The sine wave related to a musical pitch has the following form, where A is the amplitude of the sound (or the volume, measured in decibels) and B is the frequency of the note (measured in Hz):
f ( x) = Asin (Bx). See figure 4 where the frequency B determines T, the period of the function. Period is calculated as (2Π / frequency).
Students will be directed to graph a variety of chord patterns and determine, by listening and looking at their graphs, which combinations are dissonant or consonant.

Figure 4. source: Wikimedia
Within the key of C the only recognized chords are built off of the notes of the respective major scale. This causes some chords to be major and some minor, because of the unequal spacing of tones in the scale. To build the standard three-note chord we start with any of the tones of the C major scale, skip one, then use the next one, then skip one again and use the next one after that. The first chord of C major is C-E-G. Because the bfirst interval formed, between C-E is a major third, we call this a major chord, C major. The next chord built in similar fashion is D-F-A. Because the interval between D and F is a minor third this is a minor chord, D minor (Levitin, 2006).
If we graph the sine waves of the three notes, C-E-G, we will notice that all three intersect at a specific point. The intersection point for C will be exactly 2 periods. The intersection point for E will be exactly 2.5 periods. The intersection point for G will be exactly 3 periods. This will hold true for all major chords.
Major chords and minor chords have a very different sound. Even though most non-musicians could not name a chord upon hearing it, or label it as major or minor, if they hear a major chord and a minor chord played one right after the other they would be able to distinguish the two. "And their brains can certainly tell the difference - a number of studies have shown that nonmusicians produce different physiological responses to major versus minor chords, and major versus minor keys" (Levitin, 2006, p. 267).
The sine waves for randomly selected notes will also intersect randomly. It is interesting that only when sounds fit a certain pattern do we find them pleasing, or consonant.
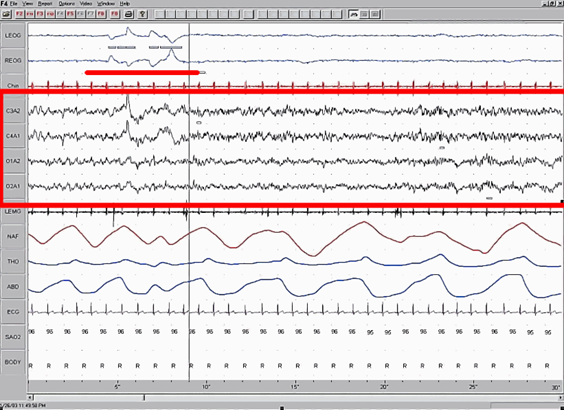
Another, although more complex, application of sine waves is in modeling brain activity through brain waves. One way to record brain activity is with the electroencphalogram (EEG) along with measures of eye movement and skeletal muscle movement. In figure 5 the EEG is highlighted in the dark box.
The heavy dark line highlights rapid eye movement (REM) sleep. There are generally two stages to sleep, REM and non-REM. Most memorable dreaming occurs during REM sleep. The EEG is characterized by rapid, low voltage. This is represented in the graph of the EEG as having a high frequency, or short period, and low amplitude. During this stage of sleep mammals lose muscle tone and are in a near state of paralysis, likely thought to prevent self-injury while sleeping.
The deepest sleep is characterized by a graph with a relatively low frequency and resulting longer period.

|
Figure 5.
|
|
source: Wikimedia
|