Table 1 - Life Expectancy data For Malawi, Bangladesh, India, China and United States: 1960 - 2017
|
Life Expectancy |
|
|
|
|
| Year |
Bangladesh |
China |
Malawi |
United States |
India |
|
|
1960
|
45.8
|
43.7
|
37.8
|
69.8
|
41.2
|
| 1965 |
48.7 |
49.5 |
38.9 |
70.2 |
44.4 |
| 1970 |
47.5 |
59.1 |
40.6 |
70.8 |
47.7 |
| 1975 |
48.9 |
63.9 |
42.8 |
72.6 |
51 |
| 1980 |
53.5 |
66.8 |
44.8 |
73.6 |
53.8 |
| 1985 |
55.6 |
68.5 |
46.1 |
74.6 |
55.8 |
| 1990 |
58.4 |
69.3 |
46.6 |
75.2 |
57.9 |
| 1995 |
61.9 |
70.2 |
46.6 |
75.6 |
60.4 |
| 2000 |
65.3 |
72 |
46.5 |
76.6 |
62.6 |
| 2005 |
67.9 |
74 |
49.8 |
77.5 |
64.6 |
| 2009 |
69.8 |
75 |
55.7 |
78.4 |
66.2 |
| 2010 |
70.2 |
75.2 |
57.3 |
78.5 |
66.6 |
| 2011 |
70.6 |
75.4 |
58.7 |
78.6 |
67 |
| 2012 |
71 |
75.6 |
59.9 |
78.7 |
67.4 |
| 2013 |
71.4 |
75.8 |
61 |
78.7 |
67.7 |
| 2014 |
71.8 |
75.9 |
61.9 |
78.8 |
68 |
| 2015 |
72.2 |
76.1 |
62.7 |
78.7 |
68.3 |
| 2016 |
72.5 |
76.3 |
63.2 |
78.5 |
68.6 |
| 2017 |
72.8 |
76.4 |
63.7 |
78.5 |
68.8 |
Generated from World Development Indicators; https://databank.worldbank.org/indicator/SP.DYN.LE00.IN/1ff4a498/Popular-Indicators
Table 2 - GDP per capita data For Malawi, Bangladesh, India, China and United States: 1960 - 2018
|
GDP per capita (current US$) |
|
|
|
|
| Year |
Bangladesh |
China |
United States |
India |
Malawi |
| 1960 |
89 |
89.5 |
3,007.10 |
82.2 |
44.5 |
| 1965 |
106.6 |
98.5 |
3,827.50 |
119.3 |
55.5 |
| 1970 |
140 |
113.2 |
5,234.30 |
112.4 |
61.8 |
| 1975 |
277.6 |
178.3 |
7,801.50 |
158 |
113.9 |
| 1980 |
227.8 |
194.8 |
12,574.80 |
266.6 |
198 |
| 1985 |
245.5 |
294.5 |
18,236.80 |
296.4 |
155.7 |
| 1990 |
306.3 |
317.9 |
23,888.60 |
376.6 |
200 |
| 1995 |
329.4 |
609.7 |
28,690.90 |
373.8 |
142 |
| 2000 |
418.1 |
959.4 |
36,334.90 |
443.3 |
156.4 |
| 2005 |
499.5 |
1,753.40 |
44,114.70 |
714.9 |
289.6 |
| 2009 |
702.3 |
3,832.20 |
47,100.00 |
1,102.00 |
438.2 |
| 2010 |
781.2 |
4,550.50 |
48,466.80 |
1,357.60 |
478.7 |
| 2011 |
861.8 |
5,618.10 |
49,883.10 |
1,458.10 |
535 |
| 2012 |
883.1 |
6,316.90 |
51,603.50 |
1,443.90 |
391.6 |
| 2013 |
981.8 |
7,050.60 |
53,106.90 |
1,449.60 |
348.4 |
| 2014 |
1,118.90 |
7,651.40 |
55,033.00 |
1,573.90 |
371.3 |
| 2015 |
1,248.50 |
8,033.40 |
56,803.50 |
1,605.60 |
380.6 |
| 2016 |
1,401.60 |
8,078.80 |
57,904.20 |
1,729.30 |
315.8 |
| 2017 |
1,564.00 |
8,759.00 |
59,927.90 |
1,981.50 |
356.7 |
| 2018 |
1,698.30 |
9,770.80 |
62,641.00 |
2,015 |
389.4 |
Generated From World Development Indicators; https://databank.worldbank.org/indicator/NY.GDP.PCAP.CD/1ff4a498/Popular-Indicators
Graphical Representations:
Figure 1- GDP Per Capita (Current US$) For Malawi, Bangladesh, India, China and United States: 1960 - 2015: Y-axis Linear
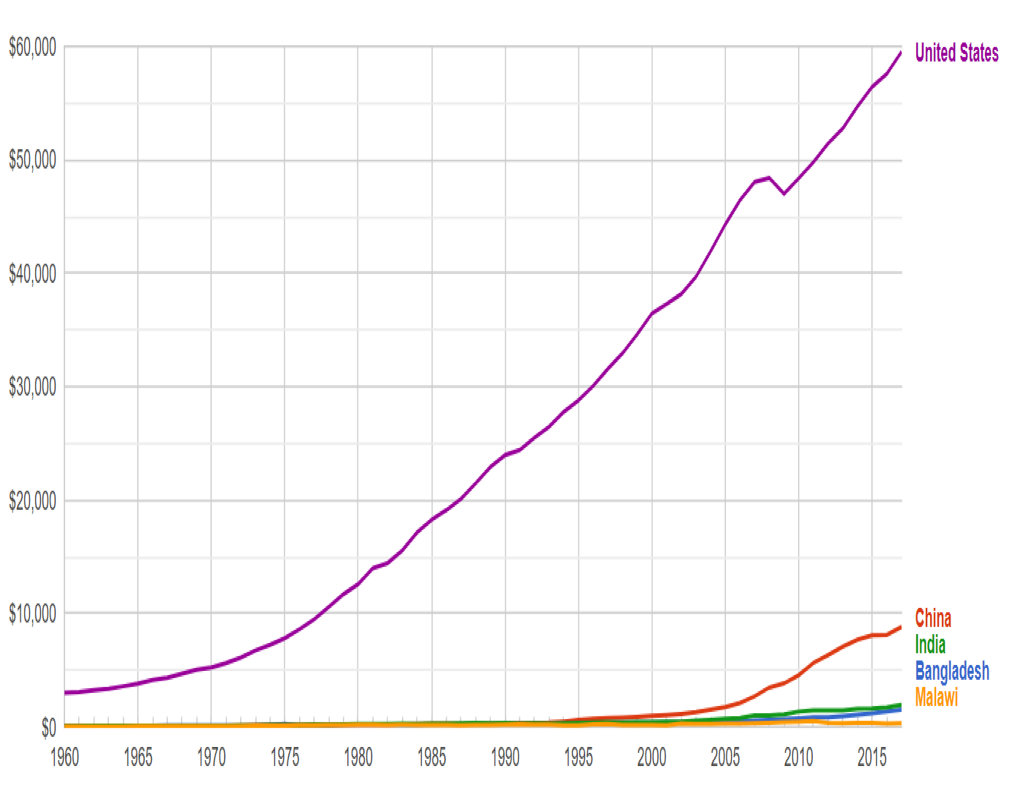
Generated From https: www.google.com/publicdata/explore
Figure 2 - GDP Per Capita (Current US$) For Malawi, Bangladesh, India, China and United States: 1960 - 2017: Y-axis Log
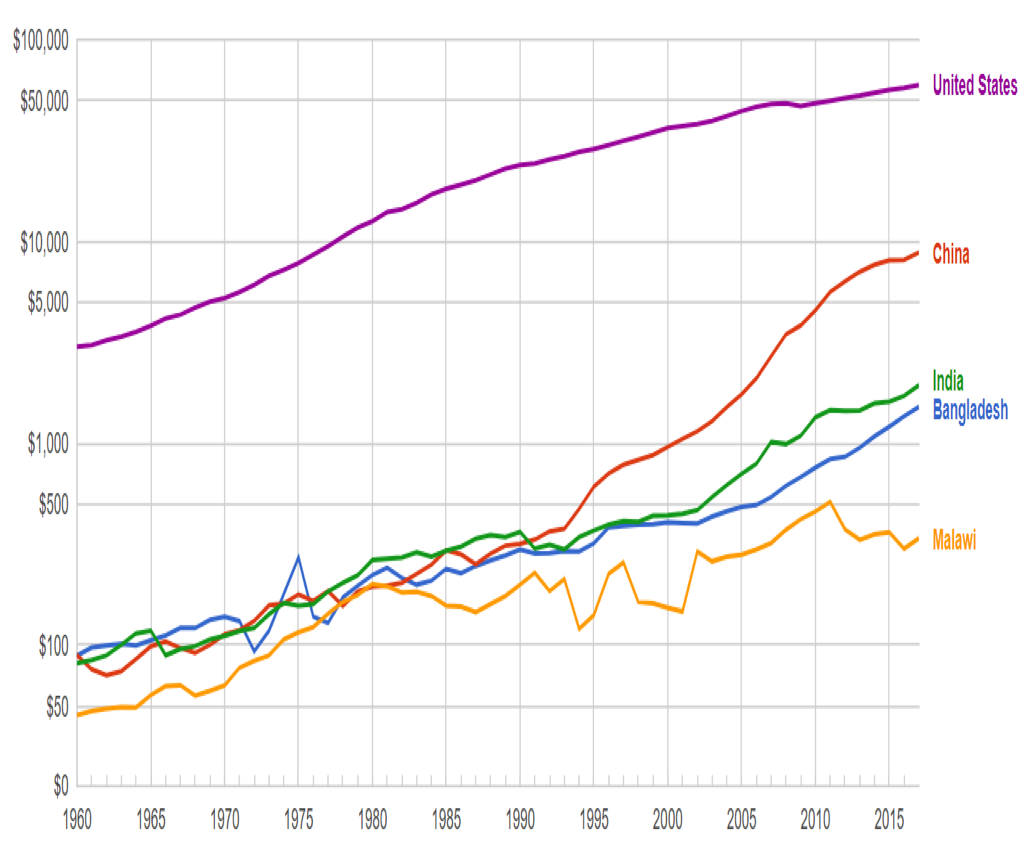
Generated From https: www.google.com/publicdata/explore
Figure 3 - Life Expectancy For Malawi, Bangladesh, India, China and United States: 1960 - 2015
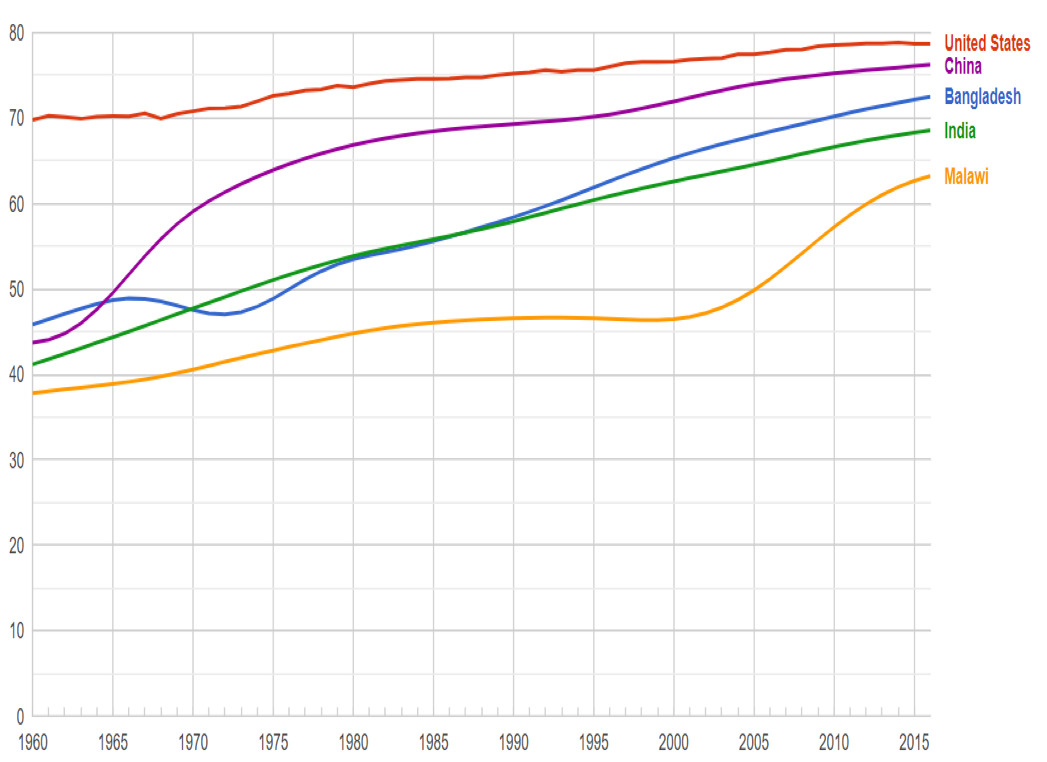
Generated From https: www.google.com/publicdata/explore