Insurance maps were developed in the United States in the late eighteenth century in response to the need for detailed information concerning potential fire risks of commercial, residential or industrial structures. One of the earliest companies to provide the service of documenting the construction materials of these structures was the D. A. Sanborn National Insurance Diagram Bureau, later called the Sanborn Map and Publishing Company.
6
Sanborn maps cover all major urban areas and many smaller cities and towns. A collaboration of surveyors and cartographers documented through these maps specific and in-depth detail, building by building, of the built environment of that time. The Library of Congress has the largest collection of Sanborn fire-insurance maps although thousands of state, local and university libraries as well as historical societies have their own smaller collections.
7
(See Figure 1)
These maps are drawn to scale and color coded to distinguish each building’s construction material -- olive for adobe, blue for stone, pink for brick, yellow for wood and gray for metal. Additionally there are symbols to record details and particulars, such as sprinkler systems, fire alarm, steam boilers, elevator details as well as window and door openings. Kim Keister’s article, entitled “Charts of Change,” clearly delineates the specifics of these maps and includes the key used to create a common and easily readable resource. Sanborn maps became an essential tool for fire-insurance companies, allowing the underwriter’s to recognize possible risks based on clear evidence of the buildings’ characteristics in particular areas.
8
Currently, Sanborn maps supply incredible historical information. As many areas were surveyed on a regular basis, sometimes as frequently as within six months time, a historical record was being kept. The evolution of cities and towns can be researched through successive surveys with buildings going up and coming down, with land being used for differing purposes, with new and necessary businesses growing or diminishing. They are a window into the changes, again as Keister’s title suggests.
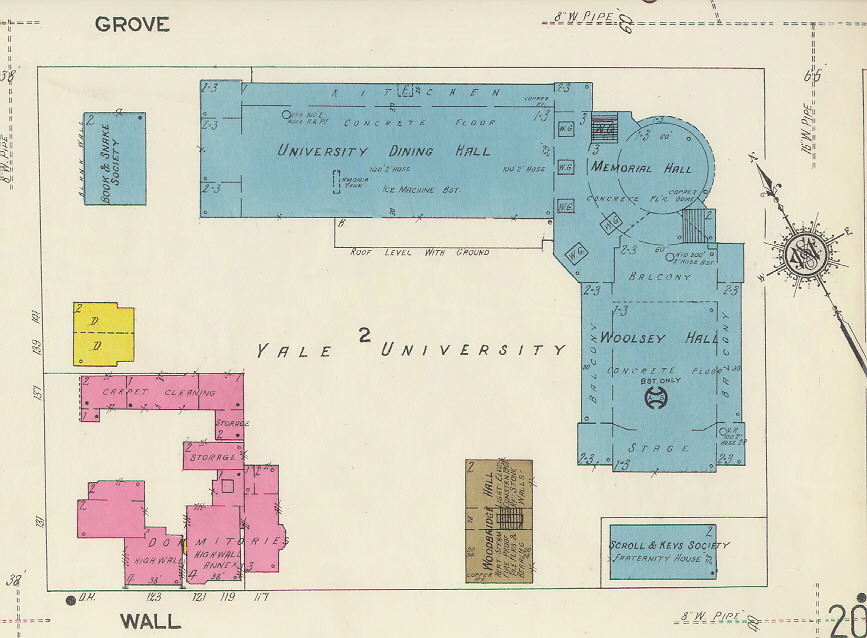
Figure 1: Sanborn map of several buildings at Yale University in New Haven, Connecticut. Courtesy of Yale University Library, The Map Collection