Ronald B. Coleman, Jr.
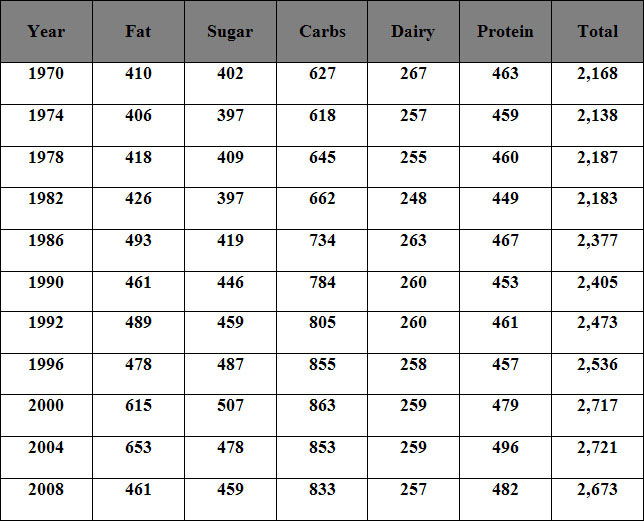
In 1970, the U.S. food system calculated that the average American consumed 2,168 calories per day. The breakdown of calorie intake by category was: 402 from added sugar, 410 from added fat. Thus, 812 calories or 37 percent of the American diet came from additives, unhealthy calories.
In 2008, the U.S. food system reported that Americans were now consuming and average of 2,673 calories per person per day. This powerful evidence that the cheap-food policy instituted by Nixon-era USDA chief Earl Butz was a huge success from the standpoint of policy makers. However, the nation now faces a vast healthcare crisis. The intense production of corn, soy, and processed goods made food more affordable, but Americans are paying the price for eating what is cheap and affordable. Over the past 40 years, calorie intake has increased by more than 23 percent. Americans are eating more and not exercising enough to burn off the extra calories. The 2008 average calorie consumption for added sugar and added fats climbed to 459 and 641 calorie respectively. Thus, 1,100 calories or more than 41 percent of the average American diet contained sugars and fat.
From 1970 to 2008, healthy protein consumption (meat, eggs, and nuts) only increased 4 percent. In 1970, the average American ate 463 calories of protein. The 2008 food system data reported that the American diet now contained roughly 482 calories of protein.
Students can use this full interactive chart to compare the diets of Americans in 1970 to 2008. They interactive chart changes numbers every two years. Students can use this data to make a line graph with two-year intervals on the x-axis.
http://civileats.com/2011/04/05/where-do-americans-get-their-calories-infographic/
Caloric Intake By the Numbers

Students should be able to create, read, and interpret a chart of caloric intake using the
data from civileats.com. Discussion of the data should lead students to notice the following trends:
-
§ The large increase in total daily calories consumed by the average American from 1982 to 1986
-
§ Total daily caloric intake peaked in 2004
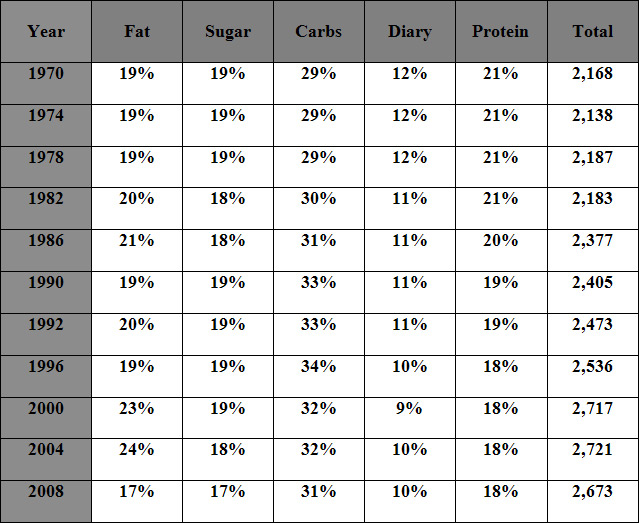
Caloric Intake By Percentages (Rounded to the nearest percent)

Students should be able to calculate the percentage of total daily intake for each food category (see below). Students can then analyze trends and point out the year of minimum and maximum percentages for each category. Overall, students should be aware that fat and carbohydrate intake increased from 1970 to 2004 while protein intake decreased. The year 2008 marks the beginning of a national awareness to the issue of obesity and proper nutrition in the country. Thus yielding a 7% decrease in the percentage of fat in the daily diet. Looking at eating habits next to trends in exercise will give a more accurate picture of a person's overall health.

Below is an extension activity for students who have already mastered the ability to chart data and calculate percentages. The online website (Civil Eats) allows students to breakdown carbohydrate intake into three separate categories: grains, vegetables, and fruit. Students can fill in a blank chart and calculate the percentage of calorie intake relative to each category.
