Lesson Plan I
Topic: Properties of Waves: Speed and Amplitude
Objectives
: Students will be able to
-
a. Identify the parts of a wave
-
b. Calculate the speed of a wave
-
c. Calculate wavelength
-
d. Calculate the period of a wave.
Content:
How fast does a wave travel? The speed of a wave can be computed by using the same method that is used to determine the speed of a moving car by applying the formula speed (velocity v) = distance / time.
Strategy:
-
a. discuss properties of waves
-
b. demonstrate the experiment on the formation of waves
-
c. Discuss different types of waves.
-
d. Identify the parts of a wave
-
e. Review the formula for distance speed and time
-
f. Show the connection between the speed of waves and the speed of a car
-
g. Worked examples on CB.
Problems for Application
:
Connect the sine curve as a model for wave. Draw and the parts of the wave draw the parallel to the sine curve (amplitude, crest, troughs, wavelength)
Lesson Plan II
Topic:
The Doppler Shift
The Essential Questions
: Why does the siren of the police seem to fade in the distance?
Objectives:
Students will be able to
-
· Use a diagram to explain the Doppler shift
-
· Solve problems involving the Doppler shift.
Background Information:
The sudden change in the police siren as the car passes by is defined as the source of motion. The Doppler Effect is the shift in the frequency and wavelength of the sound waves generated from the source moving with respect to the medium. Sound waves are produced at a constant frequency, and the wave-fronts radiate symmetrically away from the source at a constant speed, which is the speed of sound in the medium. The distance between wave-fronts is the wavelength. All observers will hear the same frequency, which will be equal to the actual frequency of the source.
Activities
:
-
i.) Introduction of the Doppler shift formula
-
ii.) Worked examples
-
iii.) Reading / research for students
-
iv.) Research paper on the uses of Doppler shift in medicine, metrology, and shipping.
Significant task
: A police cars travels down a highway at a speed of 33.5 m/s or 75miles / hour. Its siren emits sound at a frequency of 400 Hz. If you are a passenger in a car traveling at 24.6 m/ s going in the opposite direction as the car approaches the police car moves and as the car moves away from the police car, calculate the frequency for each. Draw a picture the represent the situation.
Lesson III
Topic
: Sound Levels
Objectives
:
The students will be able to
-
a.) Compare different sound levels
-
b.) Calculate sound levels
-
c.) Apply the properties of logarithms to calculating the intensity of sound.
The Essential Questions: What is the decibel level of the faintest sound that we can hear? What is the effect of the intensity of sound on the decibel level? Can the MP player damage your hearing?
Background Information
:
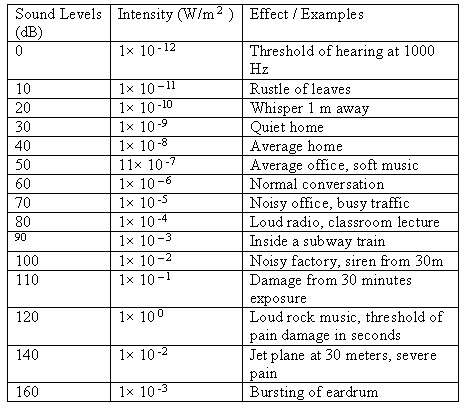
The faintest sound that the human ear can detect at a frequency of 1000Hz correspond to an intensity of 1.00 × 10
-12
This is called the threshold of hearing. The loudest sound that the ear can tolerate correspond to an intensity of 1.00 W/ m
2
. Sound intensity varies by a factor of ten. The table lists noise levels and their effect on hearing
The sound level in Β in decibels of a sound having an intensity of 1 in W/m
2
is defined as
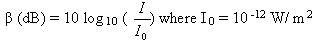
Sound level is not the same as intensity. Sound level Β is defined is a ratio, and is therefore a unit- less quantity used to compare sound level to a fixed standard 10
-12
W/m
2
Classroom problems
Calculate the sound level in decibel for a sound having an intensity of 5.00 × 10
-4
W/m
2
Lesson Plan IV
Topic: Sonic Boom
Objectives
: Students will
|
a.)
|
Describe what happens when the source of sound travels faster than the speed of sound.
|
|
b.)
|
Geometrically describe sonic boom.
|
Essential Questions
: What happens when a moving source approaches or exceeds the speed of sound?
Background:
Sounds from a source that moves faster than the speed of sound spread out spherically from the point where they are emitted. When the source exceeds the speed of sound no sound is received by the observer until the source is passed. Both the approaching sound and the receding are mixed. This is situation creates a sonic boom. A sonic boom is a constructive interference of sound created by an object moving faster than sound. This can be represented geometrically by a cone in three dimensions with overlapping circles. Inside the cone the interference is mostly destructive, and the sound intensity is less than on the shock wave.
In Class Activity
:
-
a.) discuss sonic boom
-
b.) Explore movie from the internet that demonstrate sonic Boom
The task: Students will research and make a presentation on Sonic Boom.
Lesson Plan V
Topic: Earthquakes
Objectives
: Students will be able to:
-
a.) Describe the causes of Earthquakes
-
b.) Identify regions most prone to earthquakes
-
c.) Apply the study logarithm to the forces of earthquakes.
Essential Questions
:
-
a.) How are Earthquakes formed.
-
b.) Can we predict when an earthquake will arrive?
-
c.) How are Earthquake magnitudes measured?
Background Information
:
The magnitude of earthquakes is measured on the Richter scale. The Richter magnitudes are based on a logarithmic scale. Each successive unit is ten times more powerful than the one before.
A seismometer is an instrument that senses the earth’s motion. The seismograph combines a seismometer with recording equipment to obtain a record of the motions of the earth. From this graph scientists can calculate how much energy is released in an earthquake. Seismograms are placed at different positions, some close to the earthquake and some at greater distances. The readings from all these positions are used to calculate the magnitude of the earthquake. Usually all the seismograph stations will give the same magnitude for an earthquake.
The Richter scale is open- ended. There is no limit to how small or how large an earthquake might be. Since logarithms are used to compute the size of earthquakes it is possible to have earthquakes with negative magnitudes. These earthquakes might be too small to be detected. Alternately the scale can record very powerful earthquakes. The most powerful earthquake recorded was a magnitude of 9.5 recorded in Chile in 1960.
Activities / Problems
Select problems that give practice in the properties of logarithms, but are applied to earthquakes.
1. The energy E (in ergs) released during an earthquake of magnitude R may be approximated by using the formula
Log E = 11.4 + (1.5) R.
-
a.) Solve for E in terms of R
-
b.) Find the energy released during the Alaskan quake of 1964. The earthquake measured 8.4 on the Richter scale.
Lesson Plan VI
Topic: Earthquakes: How are Earthquakes located?
Objectives
: Students will be able to:
-
a.) Find the intersection of circles
-
b.) Measure distances
-
c.) Apply the data generated from a seismograph to locate an earthquake.
Essential Questions
:
-
How do scientists locate the epicenter of an earthquake?
-
How far away from the epicenter can the waves from an earthquake be felt?
Background Information
Finding the Epicenter of the earthquake
Scientists use the seismograph a sensitive measuring devise to detect the vibrations of distant earthquakes. These seismographs are located in various places across the earth. These seismographs are located in China, in the pacific coast of the United States, the region called the ring of fire, in Australia and other places in the Southern hemisphere.
When an earthquake occurs, the shock waves spread out in all directions. Some of these waves compress the rock layers inside the earth. These compression waves called ‘P’ waves travel through the earth. The movements of these waves are recorded by the seismograph. These P waves are the first to be felt and to be recorded. Other waves, the S waves travel on the surface of the earth. These S waves move up and down and back and forth. These waves have similar behavior as the traverse waves.
Since S waves travels much slower than the P waves, the arrival of their movements are detected and recorded after the P waves. The farther away from the epicenter of the earthquake the instruments are located the longer it will take to record the movements of the P and S waves. Scientists know the speed at which both types of waves travel through their respective medium. The time lag between the arrival of the P waves and the S waves is then used to calculate the distance of the earthquake’s epicenter from the location of the instrument.
How the Location of the Epicenter is done.
Seismographs located at different parts of the world receive the movements of the waves that occur from the earthquake. Let A, B, and C represent seismographs that are located at three different centers through out the world. . The devise at center A record the earthquake waves and a distance of 500 km was estimated to be the distance from the epicenter of the earthquake. A circle of radius 500 km was drawn. It is known that the earthquakes epicenter could be any where on that circle. The center at B also receives the waves and a distance of 400 km was calculated to be the possible distance from the epicenter. A circle of radius 400 km was drawn. The possible location of the epicenter could be at the intersections of both circles. These two circles intersect in two places. To find the exact location the distance from the third center location C is needed. Location C produced a distance of 200 km. The circle of radius 200 km is drawn and at the point of intersection of the three circles will indicate the location of the epicenter of the earthquake. Scientists use the triangulation of the three data sources to locate the precise location of the epicenter of the earthquake.
Activities/ Problems
-
a) For geometry students can use graph paper and a compass to (using a scale) locate the epicenter of a earthquake.
-
b) Students can research the seismograph its origin and how it works and their locations.
-
c) Apply distance time problems