Kathleen Z. Rooney
Lessons with Bones
Height and Gender
Students will watch video from the National Institutes of Health, United States National Library of Medicine about the exhumation of bodies in Argentina and El Salvador.
17
Students will talk about the issues with a partner. Together they can make a list of known and unknown facts in the case. In regards to the skeletons, students should list the possible ways that they believe an archaeologist might begin to identify the remains of a particular individual.
Students can download data from the CDC website using data from the NHANES study
18
Using statistical software or a calculator, students will create a histogram for men and one for women that show the distribution of heights. Students should discuss shape, center and spread for the distributions. Students should determine the percentile rank of an individual in the data set. Percentile is a measure of location within an ordered distribution.
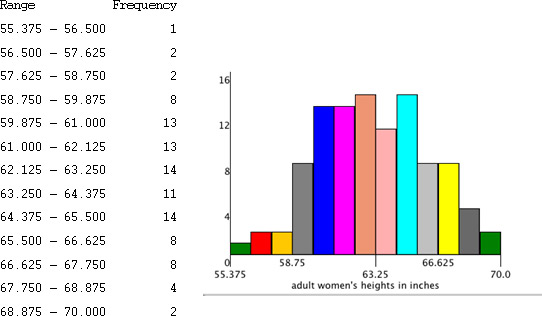
The distribution in the histogram is expressed in order from smallest to largest. The percentile is the ratio of the cumulative frequency of an individual divided by total number of individuals in the sample. For example, a skeleton that is 60.5 inches tall falls
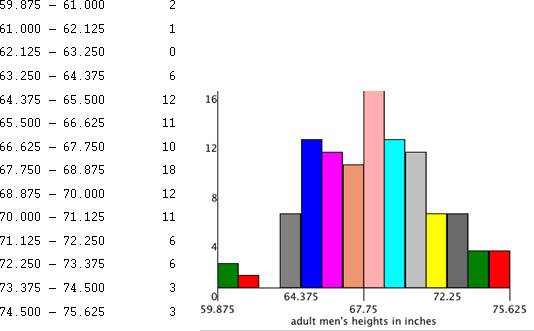
within both distributions. However it is on the far low end of the men''s distribution, only 2/100 = .02 or 2% of men are at this height or smaller. For women the cumulative frequency at 60.5 inches 26/100 = .26 or 26%. There is a 26% chance of finding a female of this height but only a 2% chance of finding a male of this height.
-
1) locate the bin that your height is in and record the frequencies in that bin and every bin below. Add all of those frequencies together to get cumulative frequency.
-
-
2) Divide (cumulative freqency/total frequency). This is the probability that a human would be the size of your human or smaller, given that they are of the gender you are looking at.
Students can extend this to draw a normal probability plot and shade the height of their skeleton on the two curves. They can estimate the mean and standard deviation from the histograms or by using the original data. Students should calculate the percentile height for both woman and man. Using tracing paper, students should create a third graph that shows the intersection of the curves and shades the area of probability for the skeleton. Students should discuss the consequences of the incorrect decision. If they already know Type 1 and Type 2 errors, that can be discussed, otherwise this is an example of for-–shadowing of that topic. (see example for pelvis size below)
Predicting height from a single bone
How can we predict someone''s size based on that single bone? This has been done with regression equations based on data from many skeletons.
19
This lab will be performed when we are looking at regression and correlation. Students will identify the bone that they have been given and measure it using the NHANES study guidelines. Although NHANES was performed with live subjects, we will approximate using this data. Students will take random samples of 50 men and 50 women using the NHANES data. Using their sample, they will find a regression model for predicting height given the length of the bone that they have been given.
A bone has been discovered, and you have identified it as a human arm bone, a radius. Using this chart predict the height of the human, to whom this bone belonged.
Estimated height:_________________________________________________
How did you estimate the height (Describe your thought process)___________
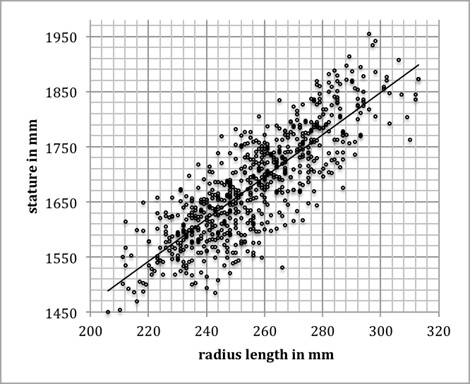
This chart is created from a large sample of measurements of human bodies.
|
·
|
Each dot represent one person, with their height measurement on the y-–axis and their radius measurement on the x-–axis.
|
|
·
|
The black line is a model called a line of best fit and is used as a prediction tool. We use it to predict the persons''s ______________ in mm from their ____________ in mm.
|
Additional questions:
Slope can be determined using two points on a line, it describes the ratio (difference in y/difference in x).
What is the slope of the line?_______________________________________________
Estimate the linear equation of this line of best fit. (hint using a point from your previous calculation (x,y) and the slope m, that you calculated: m(x-–x)=(y-–y))

Describe in words what the slope means in this context:__________________________
________________________________________________________________________
Bones and Gender
Using the tools at the same NLM/NIH website
20
, students will look at skulls for features that assist in deciphering the gender of its owner. The skull and the pelvis of an intact skeleton are often the most distinctive way to determine the gender of the individual.
Using statistics from a study of sexual dimorphism in pelvis measurements
21
students can use the mean and standard deviations to graph normal curves of pelvis sizes. Students can view images from the study or use the online tool at the University of Wyoming
22
to see the pelvis, and what measurements are indicated.
Students will each get a paper cut-–out of a pelvis to measure. Using the images from the study, or online, students should identify the area to measure and accurately measure the individual bone that they have ""found."" The pelvis was discovered during an archeological dig at a Colonial home site in the northeastern United States. The normal curves that the students have produced can be used to indicate the likelihood that the pelvis is male or female.
For example, a student measures the anterior posterior distance of the pelvic outlet of their discovered pelvis. They find a measure of 122 mm. Using the normal curves shown below, where the female statistics are μ = 114.65 and σ = 9.18 and the males are μ = 105.00 and σ = 8.05. Students can mark the point at which a pelvis with measure of 122 mm would be found within the distributions. How likely is this a female? Using the z-–score formula we calculate z-–scores for our males and our females. Male: Z = (x – μ) / σ or Z = (122 – 105)/8.05 or 2.11. Female: Z = (x – μ) / σ or Z = (122 – 114.65)/9.18.
With a table of z-–values or our calculator we can determine that about 1.7% of men have a bone that size or larger and about 22 % of women have a bone that size or larger.
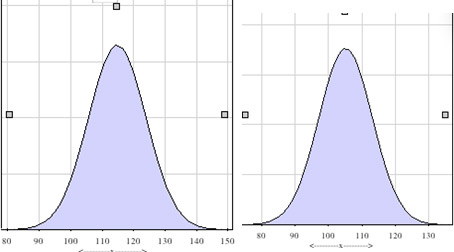
This becomes an easy bet that the bones belong to a woman.
Fingerprint Lesson
Fingerprints have several distinct categories, again with a specific probability distribution. Students will use a pre-–assessment exercise on the PBS website called
Whodunnit
.
23
Students will fingerprint themselves. A simple classroom method would be to rub a spot of pencil graphite on paper, rub their thumb on the spot and lift the print using scotch tape. Students can identify the types of fingerprint, and classify themselves according to the type they see on their fingers. Great images for these are available at the FBI website.
24
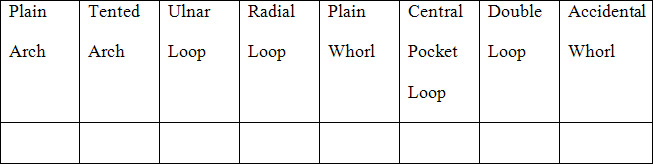
The class will create probability distribution as shown below:
Students can ""blow up"" their fingerprints using an overhead projector. By projecting the image over a grid image, students can compare regions on the grid. Working in teams (Placeholder2), students should create maps of their fingerprints. The grid should have assigned coordinates and each block should be numbered. Using a random number generator, students can pick 4-–5 blocks to compare for similarities.