Weather vs. Climate
11
Students will likely know about different weather phenomena, but may confuse weather and climate.
11
Directions
11
Read the following statements and write weather (W), climate (C), or both (B).
-
The year 1976 was one of the hottest on record.
-
1992 was one of the coldest summers on record.
-
Cities near the ocean tend to be wet.
-
Florida is hotter than Alaska..
-
It might snow in Florida tomorrow.
-
It rained on June 8
th
.
-
It is supposed to rain this weekend.
-
Today it was colder than usual.
-
Germany is a cold country.
-
Summer is hot.
-
The hottest recorded temperature of all time was 136°F in Libya.
-
It rains every October.
Key
W, W, C, C, W, W, W, B, C, C, W, C
Solar Cookout
16
There are many types of solar power, two are thermal direct conversion and photovoltaic. Photovoltaic solar power creates energy by converting solar power into electricity using solar panels. Solar thermal energy, on the other hand, uses direct solar power from the sun by converting solar energy into heat. Solar ovens do not require the use of electricity because they use solar thermal energy to cook the food. In other words, solar cookers can be used anywhere that is exposed to lots of sunlight. People around the world utilize these to cook food and pasteurize water for drinking. They are particularly beneficial because they do not pollute the environment since they use sunlight, a free, renewable energy source.
16
Solar cookers rely on three basic scientific principals: concentrating sunlight, converting light to heat, and trapping heat. Aluminum foil or mirrors can be used to reflect the sunlight so that it is more concentrated and creates a stronger energy. Light can be converted to heat through the use of a black surface on the inside of the cooker. Black surfaces absorb heat, which allows the cooker to stay hot. Finally, the use of a plastic cover allows the air inside the cooker to be isolated from the air outside the cooker. This plastic creates a greenhouse effect, allowing heat in without allowing it out by suppressing convection.
16
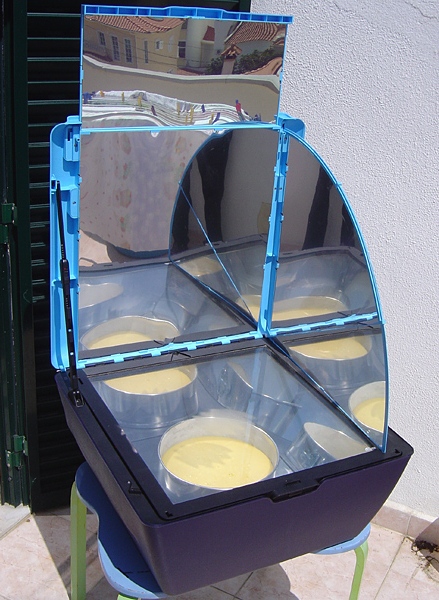
Figure 2. Photo of solar oven.
There are two major environmental benefits that solar ovens offer. First, they prevent deforestation. Wood fuel is a major source of energy for cooking. Using just one solar cooker can save up to one ton of wood per year, which can reduce a families wood fuel needs in half. Additionally, solar cookers prevent pollution. Other sources of energy, such as wood and gas, pollute the air. Solar ovens create a pollution-free alternative and sociological advantage.
16
A great way for students to learn about this alternative energy source is by actually building a solar cooker using household materials such as, a pizza box, aluminum foil, black paper, plastic wrap, and a pencil. Create a solar cooker design challenge entry form. Have students work in small groups and create a name for their solar cooker, a list of materials they used to create it, and draw and label a diagram of the solar cooker. Students can also be asked to write a paragraph explaining how their solar cooker works and why their design is the best.
16
Hosting a solar cookout is a fun way to bring a school community together in support of a common goal of exploring alternative energy sources. This solar cookout can be planned in collaboration with Earth Day by creating a Save-The-Earth themed picnic! Or the project is an awesome inquiry based design challenge. Hosting a solar cookout can allow middle school students to inform the rest of the school about a renewable and sustainable form of alternative energy – solar energy. Solar panels are used to gather energy from the sun. These ovens are of particular interest in developing countries in order to lesson air pollution and deforestation.
16
Some students may choose to use a simple pizza box design, while others may choose to research different solar cooker designs or come up with their own model. Some variables that students might choose to investigate, to see how the temperature inside the cooker is affected, include: sunny versus cloudy, shade versus direct sun light, the shape of the box, the color of the paper, angle of the flap, type of plastic, amount of foil.
16
Greenhouse in a Jar Lab
8
Question
How does the presence of increased levels of CO2 affect the temperature inside a bottle when exposed to heat?
8
Materials
The materials that are needed for this experiment include: two clear 2 liter soda bottles with labels removed, tin foil, two thermometers, one 250 mL beaker, water, one Alka-Seltzer tabled, one 150 watt light fixture, one ruler, one stop watch.
8
Procedure
8
-
Set up a lamp on the table.
-
Place the 2 liter bottles next to each other side by side about six inches away from the lap.
-
Add 200 mL of water to each bottle.
-
Hang the thermometer in one of the bottles so that it is in the middle, the thermometer should not touch the water. It is important to make sure that the temperature can be read. Use the tin foil to seal the bottle and hold up the thermometer. This bottle is the control bottle.
-
Break an Alka-Seltzer tabled in half and place both pieces in the second bottle. Quickly hang the second thermometer and close the top with tin foil as was done with the first bottle. This is the experimental bottle.
-
Turn on the lamp and make sure it shines evenly on both bottles.
-
Record the temperature of both bottles every two minutes for the next twenty minutes.
Water in the World Demonstration
12
In this demonstration students can see visually how much of different types of water are on our planet. Begin by placing 5 gallons of water in a tank. This tank represents all of the water in the word. Ask students to predict how much water is in oceans, the ground, rivers, ice caps/glaciers, freshwater lakes, inland seas/salt lakes, and the atmosphere. Remove 18 ounces of water from the tank using a measuring cup.. Using green food coloring, color the rest of the water in the tank green. This represents all the water in the oceans. The water in the measuring cup represents water that is not ocean water. Next, pour 15 ounces of the water in the measuring up into an ice cube tray. This water symbolizes water in ice caps and glaciers. The remaining 3 ounces represents the Earth’s available fresh water. Place a drop of water (0.5 ounces) into a student’s hand to represent the water found in fresh water lakes and rivers. The final 2.5 ounces is ground water. Pour it into a cup of sand to demonstrate this.
12
How Much Water Do You Use?
12
This activity is designed to help students become aware of how much water they use on a weekly basis. Have students read the story, “The Case of the Mysterious Renters” and complete a survey to find out how much water they use in their home each week. Record the activity, times were day, weekly total, water per activity, and the total water used.
12
Survey
12
Toilet Flushing: ___ weekly total x 5 gallons = _________
Short Shower (5-10 minutes): ___ weekly total x 25 gallons = _________
Long Shower ( > 10 minutes): ___ weekly total x 35 gallons = _________
Tub Bath: ___ weekly total x 35 gallons = _________
Teeth Brushing: ___ weekly total x 2 gallons = _________
Washing Dishes with Running Water: ___ weekly total x 30 gallons = _________
Washing Dishes by Filling a Basin: ___ weekly total x 10 gallons = _________
Using the Dishwasher: ___ weekly total x 20 gallons = _________
Washing Clothes: ___ weekly total x 40 gallons = _________
Follow-up Questions
12
Ask students to think about the following questions: Which activity happened most often? Which activities use the most water? Why might your answers differ from that of your classmates? Ask students to brainstorm a list of ways families can conserve water at home. Ask students to then create a public service announcement, poster, or video encouraging students to conserve water.
For example, two-thirds of the water used in the average home is used in the bathroom for activities such as showering, bathing, and flushing the toilet. By taking shorter showers that are less than five minutes families can conserve gallons of water each week. In the kitchen and laundry room, families can wait to run only full loads of dishes or clothes.
12
Estimating Bottled Water Use
13
Another great activity is to estimate how many plastic disposable water bottles are made each year. Even though Connecticut has a $.05 bottle fee, it can be assumed that many are not recycled. A class could estimate how much carbon, from oil or other fossil fuels, is used each year and find the percent of the United States energy budget it uses.
13
Bottled Water and Energy Use
13
The rising use of bottle water raises questions about the product’s economic and environmental costs. One of the most significant concerns are the resources required to produce the plastic bottle, which both energy and water. According to the Beverage Marketing Corporation, Americans bought a total of 31.2 billion liters of water in 2006. Most of this water is sold in polyethylene terephthalate (PET) bottles. PET bottles are produced from fossil fuels, such as natural gas. This water bottle production required about 900,000 tons of plastic.
9
According to the Pacific Institute in 2006 producing bottled water for American consumption required the equivalent of more than 17 million barrels of oil. This bottled water production produced more than 2.5 million tons of carbon dioxide.
9
One great classroom activity is having students figure these statistics out for themselves. Pose to your students some of the following calculations:
13
According to the plastics manufacturing industry, it takes around 3.4 megajoules of energy to make a typical one liter plastic bottle, cap, and packaging. How much energy is required to make enough plastic to bottle 31.2 billion liters of water? Answer: 106 billion megajoules of energy.
If a barrel of oil contains around 6 thousand megajoules. How many barrels of oil were needed to produce the plastic bottles used in 2006? Answer: 17 million barrels of oil
Every ton of PET manufactured produces around 3 tons of carbon dioxide. How much carbon dioxide was release in 2006 from bottled water production? Answer: 2.5 million tons.
The Pacific Institute estimates that twice as much water is used in the production of plastic bottles. How much water is used to make 1 liter of water? Answer: 3 liters of water.