Why Examine Income Inequality?
Although income inequality is seldom the focus of economics textbooks, income inequality has large ramifications on both the quality of life and perceived quality of life within a country. Countries are often compared by their gross domestic products (GDP), that is, the total amount of new goods and services the country is able to produce in a given year. It is possible, however, for a country’s GDP to increase while the quality of life of the average citizen goes down if the gap between the highest earners and the lowest earners widens. This gap is known as a wage premium. Although per capita GDP may increase, the share of national income controlled by the lowest earners may not change or may even go down. Large shares by the wealthy elite skew the data to look more favorable than in reality.
The Happiness Index
In 1972, King Wangchuck of Bhutan compared the world’s highest grossing countries by GDP and noticed large discrepancies in income and quality of life between these country’s highest and lowest earners. He also realized that these same countries often faced significant tradeoffs when it came to the environment, industrialization, and advancement. In an effort to avoid similar results in his own country, Wangchuck created a new index to measure the quality of life of its citizens: Gross National Happiness (GNH). This index considers the health, education, housing, security, leisure time, and future opportunities of a country’s citizens.
2
While the world has not embraced Bhutan’s GNH index as its measure of happiness, happiness has become increasingly closely monitored. Building off Bhutan’s work on its happiness index, the United Nations (UN) adopted a resolution in 2011 to have its member countries begin measuring overall happiness. In 2012, the UN released its first World Happiness Report, highlighting many key variables that contribute to the overall happiness of a country, such as income, healthy life expectancy, social support, freedom of choice and political participation, social trust, quality of work, and generosity.
3
The report goes on to suggest that economic prosperity is a worthy goal but should not be pursued at the expense of economic stability, community cohesion, ethics, the environment, and the happiness of its citizens. In other words, a rising GDP or rising average income is not the end-all-be-all if a wider gap forms between those at the top and those at the bottom. Despite an overall increase in GDP from 1950-2000, general happiness in the United States trended down, decreasing from an average index score of approximately 7.25 to 6. This suggests that the overall well-being of US citizens fell despite increased economic prosperity, possibly a result of ever-increasing income inequality within that same time period.
Perceived Quality of Life
Perceived quality of life should also be considered when examining overall happiness and income inequality. While incomes of the lowest earners in the United States may be significantly higher than in the past, the gap between rich and poor only continues to grow. In fact, “in 1975, the average income of households in the top fifth of income distribution was 10.3 times as large as average household income in the bottom fifth of the distribution; in 2015, average top incomes were 16.3 times as large as those at the bottom.”
4
This immense growth only serves to magnify the perception of poverty among the lowest earners. According to a study done at Michigan State University, “Poorer people feel sadder than wealthier people because income predicts greater sadness throughout the day,” even when controlling for “relevant demographics, stress, and people’s daily time use.”
5
The study goes on to suggest that money might not buy happiness, but it does reduce sadness. The 2012 World Happiness Report argues that people’s life satisfaction is greatly affected by their relative income as compared to others. In rural China, for instance, farmers tend to compare themselves to others in their villages, while in more developed nations like the United States, people tend to compare themselves with their colleagues. This need to relate one’s own happiness with relative income is known as the “external norm effect.”
6
Consequently, as the highest earners’ income rises, “happiness falls” for the lowest earners. It is thus clear that a correlation exists between happiness and income inequality.
So why study happiness and income inequality? Studying countries with a high index for happiness may provide insight into political and economic policy that can reduce income inequality and improve the overall well-being of a country’s citizens. According to the 2018 World Happiness Report, the top five countries with the happiest people include Finland, Norway, Denmark, Iceland, and Switzerland. We will later revisit some of these countries to see if there is a correlation between some of the economic, political, and social policies these countries implement and the extent of their income gap and their population’s level of overall happiness.
Defining Income Inequality through Economic Systems
Income inequality shows an unequal distribution of income among a population. Various political-economic systems have been established around the world that address the distribution of income in that type of society. For example, socialist tenets reflect the ideals of a command economy where no private ownership is allowed and a governing body determines what is produced and in what quantity. These notions theoretically pursue an equal distribution of income, which allows for increased equality and access to resources and necessities. In contrast, free market economies allow for private land ownership and give power to private markets to determine what is produced and in what quantities based on the supply and demand of that economy. One of the prevailing characteristics of a free market economy is a lack of government regulation. Instead, the prices adjust to surpluses and shortages automatically to correct for any market failures that might exist. Adam Smith describes this economic adjustment as the workings of the invisible hand. Most associate this type of economic system as laissez faire capitalism. Socialists may argue that the competitive nature of capitalism reinforces income inequality by rewarding those that control industry. The more successful a company is, the more money those that work for that company earn, thus driving a wedge between the successful and the not successful. A mixed economy combines the ideas of command and free market economies, allowing private land ownership and a private market that determines what is produced and in what quantity. Unlike a true free market economy, however, the government has the ability to regulate markets. The United States operates as a mixed economy. The government plays a large role in the redistribution of income in a capitalist society. Therefore, it stands to reason that income inequality within a mixed economy is somewhere between that of a socialist and a laissez fair capitalist economy.
Measurements and Indicators of Inequality
Lorenz Curve
The Lorenz Curve measures the percent of a nation’s income as a function of the percent of the nation’s population. A perfectly equal society is demonstrated as a line with a slope of 1, indicating that the marginal percent change in the population results in an equal marginal percent change in the share of the nation’s income. For example, the bottom 25% of the population would own 25% of the nation’s income while the bottom 50% would own 50% of the nation’s income. This can be seen in Figure 1 as the line of equality. A nation with an unequal distribution of income would have a Lorenz Curve that is bowed inward. The further the Lorenz curve bows from the line of equality, the greater the income inequality of the nation. Theoretically, a socialist society would have a Lorenz Curve closer to the line of equality while a laissez faire capitalist society would have a Lorenz Curve further from the line of equality.
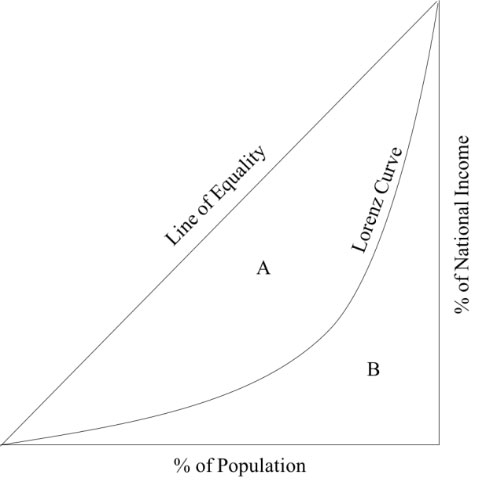
Figure 1. an example of a Lorenz Curve.
Gini Coefficient
The Gini coefficient is one of the most widely used measures of income inequality and can be used to draw comparisons between countries. The coefficient is measured on a scale of 0-1, with 0 representing an equal distribution of income among a population and 1 representing the most unequal distribution of income. For example, if every person in a country earns the same amount of income, that country will have a Gini coefficient equal to 0. If, however, one person in the country receives all the income and everyone else has no income, then that country will have a Gini coefficient of 1.
A country’s Gini coefficient is tied to its Lorenz curve. Figure 1 divides the Lorenz curve graph into regions A and B. Region A represents the difference between the line of equality and the Lorenz curve itself. The Gini coefficient is calculated as the ratio of Region A and the sum of Regions A and B. A country without income inequality will have no region A, explaining why its Gini Coefficient is 0.
According to the Central Intelligence Agency World Fact Book, the five countries with the lowest Gini Coefficients include Finland (0.215), Faroe Islands (0.227), Slovakia (0.237), Slovenia (0.245), and Ukraine (0.246).
7
Of the 25 countries with the lowest Gini Coefficients, 13 also happen to be among the 25 happiest countries according to the World Happiness Report.
8
What does income inequality look like in the United States?
According to the United States Census Bureau, in the United States in 2016, the top quintile of income earners earned approximately 51% of all American income while the bottom quintile earned just 3.1% of all American income.
9
These statistics translate into a Gini coefficient for the United States of 0.481.
10
Is Income Inequality “Bad?”
Income inequality is not innately bad. Rather, the extent to which income is distributed reveals much about that society. For instance, some level of income inequality can actually have positive ramifications on the innovation and advancement of a country. Consider the political and economic history of China during its cultural revolution. David Kestenbaum reports in the Planet Money episode “The Secret Document that Transformed China” that in 1978, a group of Chinese farmers signed a secret agreement to increase production beyond the government’s established quotas.
11
As part of the agreement, individual farmers could keep the surplus they produced. This agreement incentivized farmers to work harder and look for cheap methods to increase productive efficiency. Before the secret agreement, farmers didn’t care how much they grew, because it all belonged to the government. Once they agreed to keep the surplus as their own, the farmers started working before the sun came up and kept working until after the sun went down. Productivity skyrocketed, which is what eventually led to them being discovered. The farmers were so successful, though, that the political leaders excused their disobedience and gave permission to the farmers to continue their work as an economic experiment that would eventually transform China’s approach to agriculture along with the country’s entire economic structure. China’s Gini coefficient in 1978 rose from approximately 0.305 to 0.465 in 2016, making it pretty close to that of the United States.
12
Despite the significant increase in income inequality, the standard of living in China as a whole has greatly increased. Kestenbaum reports that “since the farmers in Xiaogang signed that contract, something like 500 million people in China have risen out of poverty. They’ve moved from mud huts with dirt floors and oil lamps to houses with electricity.”
13
Meanwhile, technological innovation in the United States can actually be attributed to competition fostered by capitalism. According to the Bureau of Economic Analysis, the digital economy has grown nearly 3.7 times faster than the country’s GDP over the last 11 years (2005-2016). Although there are intrinsic, altruistic motives behind some innovation, financial incentives certainly don’t hinder the process. There is a reason that the median income of residents in Silicon Valley ($137,000 a year) is double that of the national average ($57,600).
14
Certainly less innovation would occur if less financial incentive was provided. In the cases of farming in China and technological innovation in Silicon Valley, income inequality has risen, but so has the standard of living across the nations as a result.
Redistribution of Income in the United States
There are several measures that a country can take to redistribute income to decrease income inequality. One of the main strategies used is a progressive tax system; that is, a tax system in which the marginal tax rate increases as income increases. Thus, many countries’ Gini coefficient is reported both pre- and post-tax. The United States, for instance, had a pre-tax Gini coefficient of 0.48 in 2013 but a post-tax Gini coefficient of 0.44.
15
The difference between these two values hints at the extent to which the government redistributes income. Meanwhile, Sweden and the Netherlands have comparable pre-tax Gini coefficients to the United States (0.44), but have significantly lower post-tax Gini coefficients (0.28).
16
This discrepancy suggests that Sweden and the Netherlands redistribute income through taxation more aggressively than the United States does. This is easily seen by examining the countries’ marginal tax rates. The highest marginal tax rate in the United States is 37% whereas the highest in Sweden is 56.4%.
17
The Netherlands and Sweden are also on the top 10 list of happiest countries as reported by the World Happiness Report.
18
Income is also redistributed through a series of transfer payments or social welfare programs, which include, but are not limited to, Medicare, Medicaid, subsidized housing, the free- and reduced lunch program, ObamaCare, EBT, and social security. These programs are known as transfer payments specifically because of their ability to redistribute income from the highest earners to the lowest earners. In 2016, 24% of the federal budget was spent on social security; 26% on Medicare, Medicaid, CHIP, and marketplace subsidies; and another 9% on safety net programs. Nearly 60% of the budget focuses on the redistribution of income in the United States.
19
Not all taxes in the United States, however, are progressive in nature. Instead, some taxes, such as those on alcohol, tobacco, gambling, and sugar (commonly referred to as “sin taxes”), actually behave more regressively. Because each of these goods – or “bads” if you will – make up a larger percentage of a low earner’s income, the tax burden is more heavily felt by the poor than by the rich. This concept is explained using the income effect. While sin taxes may have some success in reducing consumption, they certainly impact the poor disproportionately. Benjamin Lockwood explains in his paper “Regressive Sin Taxes” that “cigarettes and sugary drinks are consumed disproportionately by the poor, and energy efficiency subsidies are taken up disproportionately by the rich.”
20
In other words, corrective taxes and subsidies have the tendency to redistribute income from the poor to the rich. This leads many to argue that sin taxes should be reduced in an effort to help close the gap in income inequality.
The next few sections will underscore some of the challenges that lead to increased income inequality in the United States along with possible strategies for reducing the gap. Each section references content that is directly addressed in the AP curriculum.
Trade and Inequality
Classical microeconomic theory argues that free trade increases access to goods and services, which in turn increases competition and drives prices down. The ultimate effect for consumers is a large increase in consumer surplus. But what is the tradeoff? According to data from the US Department of Commerce, throughout the 2000s, large American companies responsible for employing about a fifth of Americans downsized their American factories in favor of producing abroad. This translates to a loss of about 2.9 million American jobs.
21
This type of structural unemployment has large ramifications for those Americans affected by the decision to outsource. Moreover, the types of jobs that are typically outsourced tend to be lower skilled jobs like manufacturing that pay low salaries. Outsourcing allows these companies to drastically cut operating costs and increase profits. Increased competition in the low-skill labor market drives wages down while raising earnings for owners or stockholders, further increasing the inequality gap, or wage premium, between the highest and lowest income earners.
22
Because high skill jobs are less frequently outsourced, competition for these jobs remains low, allowing high skill workers to maintain higher salaries.
Additionally, American producers who do not outsource are forced to compete with both international producers and American producers who choose to outsource, causing them to lower prices without the added benefit of lower costs. This decrease in price greatly restricts the producer surplus of American producers who choose not to outsource and could theoretically contribute to these firms eventual shut down. So while international trade does provide huge benefits to consumers from a pricing standpoint, it also has large ramifications on the low-skill labor market and those who choose not to engage in outsourcing.
Finally, Atkinson argues that technological progress favors skilled workers. He calls this the “skill-biased technical change hypothesis.”
23
The hypothesis essentially states that technical innovation drives down the demand for low-skill labor, ultimately lowering wages for these employees. By introducing new technology, a larger wedge is driven between low and high skill labor, making the substitutability between the two different types of skilled workers even less.
One way in which the government can intervene to restrict trade and protect the American worker is to impose trade tariffs. A tariff makes international trade more expensive. Tariffs raise the price of foreign-made products, which allows domestic producers to charge a price closer to that of when no foreign trade exists. With increased foreign prices, there’s less incentive to outsource labor, which decreases competition and drives domestic wages of low skill jobs back up.
So which is better for decreasing income inequality: free trade or tariffs? Free trade keeps prices low, but could also result in a loss of low-skill domestic jobs. Meanwhile, tariffs raise prices for consumers, but may result in an increase in domestic employment. There is no easy answer to this question. A decrease in price levels equates to a real increase in wages; however, an increase in employment could also result in an increase in real wages. The question thus becomes one of impact. Does the effect of free trade have a greater impact on price levels than tariffs do on employment levels? Consider the current trade war between the United States and China. According to CNN Money, the United States has a $337 billion trade deficit with China, a deficit that Washington and Beijing hoped to shrink by increasing Chinese imports of US energy and agriculture.
24
With President Trump’s plan to impose $50 billion of tariffs, however, China has retaliated, imposing its own tariffs on many of the agricultural products like soybeans that it had previously considered importing more of. The impact of a tariff is larger than the basic impact discussed in AP Microeconomics, especially when it plays out as an iterative game. Tariffs that initially impacted the markets for solar panels and washing machines have ultimately led to additional tariffs in a wide array of markets in both the United States and China. Given the current political climate, one might be able to argue more easily for the benefits of free trade in combatting income inequality as the trade war seems to be escalating in a way that classic models taught in AP might not suggest. Atkinson also argues in favor of globalization, but with two caveats. The first is to raise the country’s skill level by investing in human capital, and the second is to lower student loan interest rates to make it cheaper to invest in human capital.
25
Externalities and Inequality
An externality is a cost or benefit that someone receives without having to pay for the product that yields the cost or benefit. Two types of externalities are examined in the AP curriculum, positive consumption externalities and negative production externalities. A positive consumption externality exists when people outside the given market benefit from other consumers using the good or service. For example, an unvaccinated child benefits from his peers being vaccinated as he becomes increasingly less likely to get sick as more of his peers are treated. In this case, the marginal social benefit of a vaccine is greater than the marginal private benefit. The externality can be measured as this difference. Meanwhile, a negative production externality exists when people outside the given market bear a cost because of the production of a good or service that they don’t use. For a town that is downstream from a factory that pollutes a river with chemical waste, the negative externality represents the cost to clean up the pollution. Negative externalities are measured as the difference between the marginal cost to produce the product and the marginal social cost.
The 2012 World Happiness Report explores education as one of the major domains that affects well-being. Actually, the report describes education as “a two-way interaction” in that “education affects a person’s happiness, but happiness also affects the ability to learn.
26
” Economists typically agree that education (i.e. investment in human capital) is a huge component of economic growth and stability. Even beyond the gains to income associated with each additional year of education, higher education contributes to “longer, fuller, happier lives.”
27
Economies that invest highly in education see higher returns in unity, trust, health, and societal contributions while also experiencing decreases in suicide and crime. Thus, society as a whole reaps the gains of every individual that chooses to pursue higher education. Given the many positive externalities that stem from education, it is no wonder that the 2012 World Happiness Report argues in favor of “raising…the compulsory minimum school leaving age.”
28
In his paper titled “Social and Economic Returns to College Education in the United States,” Michael Hout analyzes the costs and benefits of higher education.
29
Comparing sticker prices of public and private universities between 1981 and 2009, both increased by an average rate of approximately 125% above the inflation rate. Despite the drastic increases in the cost of college, the benefits still outweigh the costs. Men with college degrees are expected to earn an $18:$1 return on their investment while women are expected to earn a $10:$1 return on their investment in college. The payoffs extend to society as well. Hout cites a study in Texas that found “the combined benefits of lower use of public assistance, lower crime and incarceration, and higher payback in the form of sales, property, and state income taxes yielded Texas more than $4.00 for every $1.00 invested in higher education.”
30
Hout found similar returns of $3.65 in California. Despite an abundance of research evidencing the benefits of higher education on society and that the benefit outweighs the ever-increasing cost, it is clear that the price of college disincentivizes some students from pursuing higher education. This concept is easily studied through the lens of positive externalities in the AP curriculum, which indicates that markets that produce positive externalities produce less than the socially efficient level of output. The AP solution? Subsidization. A few European countries like Norway, Finland, Sweden, Germany, Slovenia, and France offer free to virtually-free college tuition at public universities. Free tuition helps recapture the part of the market that has been priced out, which helps reduce the gap in income inequality. Note that each of these countries share Gini Coefficients under 0.30
31
and all, other than Slovenia, share happiness indices greater than 6.4.
32
This is not to say that free or subsidized education will solve the United States’ income inequality woes; however, the data may present a reason for the US to slow or decrease its increasing tuition rates if it has any aspirations to decrease the extent of its income inequality.
Increasing human capital cannot wait until high school and college. According to the National Center for Education Statistics (NCES), only about 42% of children ages 3 to 5 attended pre-primary school in 2016.
33
The positive externalities associated with such education are astronomical. Not only are these children more likely to earn higher wages later in life, but they will also greatly impact society as a whole. One study published by Lawrence Schweinhart details the effects of early childhood education on high-risk children in Michigan. The study began in the 1960s, and researchers continued analyzing participant data through the age of forty. Their results were staggering. The cost per participant was $15,166 with a return to society of $244,812. That’s a $16.14 return on each dollar invested. Nearly 80% of that return went to the general public in the form of crime savings, taxes on earnings, education savings, and welfare savings.
34
The importance of early childhood education in reducing income inequality is clear. NCES, however, reports that children with parents that have a professional or graduate degree are 80% more likely to attend preschool than those with parents that did not finish high school.
35
To decrease income inequality, society must increase access to quality early childhood education in high-risk areas. In alignment with the AP curriculum, subsidizing early childhood education would increase market output to more closely approximate that of the socially efficient level of output.
Patents and Inequality
Barriers to entry serve an important role in decreasing competition within a market, thus allowing firms a greater opportunity to earn increased profits. Perhaps the most common barrier to entry is a simple patent, which Angus Chu argues has a negative impact on income inequality. In his paper, “Effects of Patents versus R&D Subsidies on Income Inequality,” Chu argues that “strengthening patent protection causes a moderate increase in income inequality and consumption inequality.”
36
Patents, however, also provide positive effects on the economy, including having “an incentive function to innovate” and “a protective function to sustain competition based on innovation.”
37
But perhaps these benefits over-exaggerate the importance patents play in the economy. Chu proposes R&D subsidies as an alternative to patents, arguing that “raising R&D subsidies causes a relatively large decrease in both income inequality and consumption inequality” and that if the government aims to promote innovation and economic growth, “then the government should raise R&D subsidies instead of (or at least in combination with) strengthening patent protection.”
38
Providing subsidies decreases the cost to innovate without decreasing competition, thereby providing downward pressure on prices and increasing accessibility to potentially important products, such as pharmaceuticals.
Labor Markets and Inequality
Classical economic theory does a poor job explaining labor markets. Using basic ideas of supply and demand, minimum wage can easily be debunked as an appropriate stratagem for reducing income inequality. A wage floor indicates that the quantity of labor demanded will decrease while the quantity of labor supplied will increase. This policy thus increases unemployment by causing a surplus of labor or a shortage of jobs. Minimum wage is thus great for those who can find jobs, but negative for those who find themselves unemployed. Similar to the previous topics, the change to minimum wage would have a disproportionate effect on low income earners. Research, however, shows that the classic effects do not ring true. In fact, more often than not, employment increases. William Lester found that between 1987 and 2012, “states raised the minimum wage 91 times when the unemployment rate was at or above 7 percent. Unemployment fell on 47 occasions and remained unchanged on 4 occasions.
39
” Additionally, states that raised their minimum wages realized lower unemployment rates than the national average 51 times. It thus seems inconclusive that raising the minimum wage during periods of high unemployment would actually cause the traditionally believed increase in unemployment.
Additionally, federal minimum wage has not kept up with inflation over the years. David Cooper from the Economic Policy Institute cites, “In 2016, the federal minimum wage of $7.25 was worth 10 percent less than when it was last raised in 2009, after adjusting for inflation, and 25 percent below its peak value in 1968.”
40
If minimum wage has risen slower than inflation, than clearly traditional theory will not hold. Rising revenues are outpacing rising costs for firms, which only further increases income inequality. Cooper argues that policymakers have “long acknowledged that…the poverty line,” which was established in the 1960s, “is woefully inadequate as a measure of what is truly needed for a family to afford the basic necessities.”
41
Moreover, a parent working at minimum wage doesn’t even earn enough to live above the federal poverty line, creating lower standards of well-being. The Raise the Wage Act of 2017 proposes increasing the minimum wage to $15 per hour by 2024, which Cooper claims will not only result in a 31.3% increase in annual wages for minimum wage workers, but also have spillover benefits that will indirectly affect another 19 million workers who work above minimum wage and whose wages must now adjust to compensate for the minimum wage increase. “All told, raising the minimum to $15 in 2024 would directly or indirectly lift wages for 41.5 million workers, 29.2 percent of the wage-earning workforce.”
42
There shouldn’t be a question of whether or not to raise the minimum wage, but rather a question of how much we need to raise the minimum wage in order to reduce income inequality.
One alternative to raising the minimum wage is to establish a guaranteed (or universal) basic income (GBI or UBI), which guarantees all residents a minimum amount of money on which to survive, regardless of whether or not they work. Such a policy would eliminate the need for most other transfer payment programs, though it would not come without much debate. The pros and cons of GBI will, in fact, be the subject of an in-class debate, which will be described in the “Classroom Activities” section.
Trade unions serve as another effective strategy to raise wages. However, Atkinson cites the OECD report
Divided We Stand
, stating that, apart from Spain, “trade union membership was lower in 2008 than in 1980,” which according to Thomas Lemieux has been attributed to “a significant fraction of the growth in wage inequality in the United States and the United Kingdom.”
43
As union power diminishes, workers lose the benefits that stem from collective bargaining, such as working conditions, salary negotiation, and paid leave. With a decline in unionization, it becomes increasingly important for workers to have as much information as possible when trying to negotiate their salaries on their own. Lisa Pollack discusses the effects of transparent pay practices on the Planet Money episode, “When Salaries Aren’t Secret.” She argues that when employers and employees have asymmetric information, the person with less information is always worse off. When it comes to hiring practices, this often means that two people can be hired to perform the exact same job, but these people will often have drastically different salaries. This discrepancy comes from the fact that employees don’t often know what their labor is worth to a firm. But when salaries are transparent, workers gain a better understanding of what their labor is worth, which gives workers more bargaining power. Pollack reiterates that not all employees with similar job titles get paid the same because they don’t always carry the same responsibilities or perform the job with equal skill. However, salary transparency does share many of the benefits experienced through collective bargaining with trade unions.