The unit is distributed into parts scaffolding mathematical statistical skills and social scientific concerns. Each piece of this unit corresponds directly with the unit goal of displaying and presenting knowledge of graphs, statistics, and current health trends in today’s youth.
While the unit is presented in different components, the mathematics vocabulary dictionary, personal health tracking journal, and graphing portfolio will run throughout the duration of the unit. Each student will receive a notebook to be used for their health journals. The graphing portfolio will be a collection of all graphs created throughout the unit.
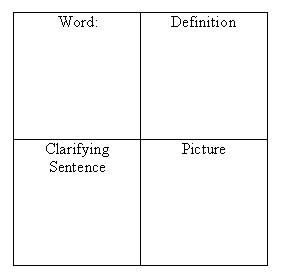
The students’ mathematics dictionary is a year long compilation of all the mathematics terms they have learned throughout the year. At the top of each page students have one letter of the alphabet, i.e. at the top of the first page students write the letter “A”, at the top of the second page students write the letter “B” and so on. Throughout the unit students will come across new vocabulary that will be entered into their journal. Some of the required vocabulary will be researched and completed for homework. Students will write the word, the definition, use it in a clarifying sentence, and draw a picture of it. A clarifying sentence is a definition in the students’ own words or a sentence using the key words to shorten a lengthy definition. The students will complete and turn in their dictionary for a grade and it will be returned to them for future reference. See example below:

The personal health tracking journal will be compiled a notebook. This journal will be used for students to record their personal health data which will be decided upon at the completion of the first lesson. Students will probably track their food consumption, exercise, time watching television, time on the computer and playing video games, and amount of time spent sleeping. These numbers will be used to create a variety of graphs.
Often throughout the unit there are class and small group discussion pertaining to the created graphs. This is to encourage student discourse and help prepare the students for similar questions in their final graphing portfolio.
Students will also create a graphing portfolio which will be used to assess the final drafts of all their graphs. Based on the graphing portfolio checklist (Appendix A), this portfolio will contain a frequency table, bar graph, double bar graph, pictograph, pie chart, line plot, and stem-and-leaf plot.