Environmental Agents of Mathematics: Mathematicians for Change
William Lawrence McKinney
Your feedback is important to us!
After viewing our curriculum units, please take a few minutes to help us understand how the units, which were created by public school teachers, may be useful to others.
Graphing Points and the Carbon Cycle
Objective
To practice plotting points and to identify the directions in which carbon moves throughout the carbon cycle.
Directions
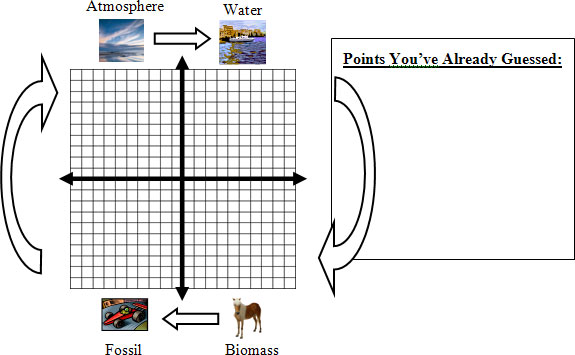
To play this game, plot 6 points. Each point you plot represents a carbon molecule in the atmosphere. The game is then played like Battleship: your opponent and you, on alternating turns, attempt to guess where the opposite player plotted his or her points. When the location of a carbon molecule is found, the player that found the molecule will draw a card that indicates where in the carbon cycle the molecule will travel. The first player then hides the molecule at some point in that section of the board. The player that transfers at least 3 molecules to at least 3 different regions wins. Record the points you've already guessed in the box provided. This will help prevent you from repeating your guesses.
The Game Board

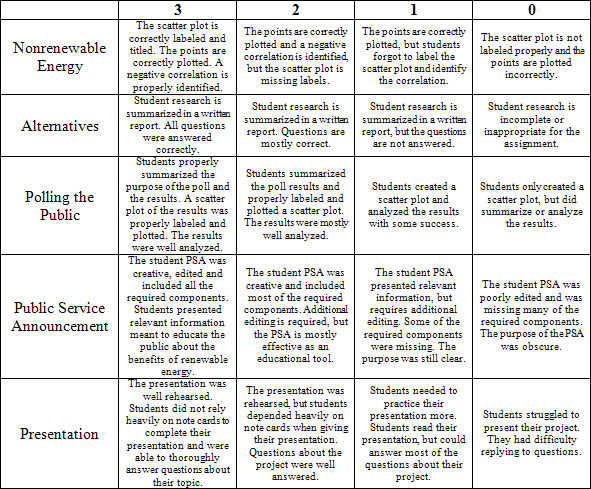
Capstone Project Rubric
The provided rubric and grade scale are recommended, but may be adjusted according to the needs of the classroom. This rubric scores students on each of the four sections of the project along with the presentation of their project.

Total Score _____________
A 13-15 B 11-12 C 8-10 D 6-7 F 0-5
Implementing District Standards
The described standards are given in the New Haven algebra 1 curriculum for unit 3.
-
2.1a1 Compare, locate, label and order real numbers on number lines, scales, coordinate grids and measurement tools. (unit addresses graphing points on the coordinate plane in lesson 1).
-
4.1a1 Collect real data and create meaningful graphical representations of data. (data collection occurs throughout several activities and is then organized as scatter plots to be analyzed in real world contexts).
-
1.1a1 Identify, describe, and create numeric, statistical patterns, using tables, graphs, in words and symbolic rules. (patterns and correlation are observed and analyzed using data from the Energy Information Agency. Students use tables and graphs to make predictions about future reserve levels).
-
1.2a1 Represent functions and relations on the coordinate plane. (unit addresses functions in the coordinate plane with all the activities, but is the focus of the first lesson's first activity).
-
-
-
-
-
-
-
-