If at all possible, do this lesson as close to the beginning of school as possible. The data collected in this unit will be used throughout the year as a reference used for various future lessons.
Materials:
· Journal
Objective: Students will be able to collect data and analyze the results.
Students are going to record everything they consume, food and beverage, over the course of a weekend. (You may want to do a similar project for one day to get the students used to keeping track of what they consume) If possible, have them record how much of each thing they ate. For prepared foods, like a Happy Meal, have them list what the meal consisted of.
When the students have their lists complete, they need to break everything down. For example, if they ate mac n' cheese, they should list wheat, cheese and milk for the pasta and cheese sauce. The Happy meal can be listed as beef, wheat, potatoes and soda (you can break this down using another lesson or in science class). Chances are, most kids don't think about where their food comes from or what is in it.
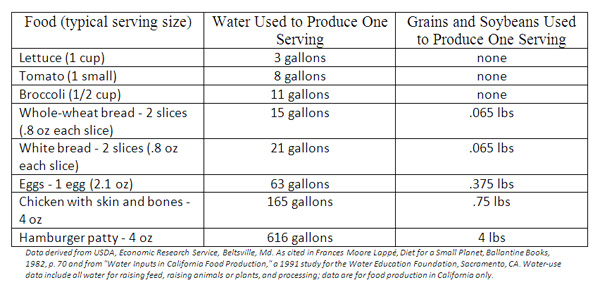
Once the students have reduced their food to basic ingredients, have them list the frequency of certain foods. What patterns do they see? How much of their food is "natural" versus processed? Use the table below as an example for them to see how much water it took to produce a typical meal.
There are many other sources that would be great to see how much fuel is used to produce the same amount of food or how many steps it takes for the food to get from the farm to the plate.
Students can use their data to show the percentage of what they consume. Have the students list the amounts of food they consume in order. They can compare it to "My Plate" to see if they are getting what the government considers a healthy meal. How far did their food have to travel? Did the pork in their hot dog come all the way from Iowa? Did that strawberry come from Lyman Orchards, California or South America? How much of what they consumed actually came from Connecticut? How could they increase the percentage of food they consume to come from within a 50-mile radius?
The data the students collect can be used over the course of the entire school year. Also, you can have the students update their journal with newer data every month or term. This way, the students can see if their eating habits change over time. Perhaps student diets will change the more informed they become. The percentage of imported food might increase over the winter months when some fruits and vegetables are not available locally. The students can recalculate their findings and compare them to the Fall when classes started.