Due to the presence of humans and their actions, the earth has undergone environmental changes. Climate scientists have been observing trends since the 1950’s and have noticed that there is evidence that the atmosphere and the oceans have warmed, the extent of ice cover and glaciers have decreased, the sea level is rising, and that the concentration of greenhouse gases have increased.
4
Looking at the thirty year span of 1983 to 2013, it is likely that it was the warmest thirty year period in over one thousand-four hundred years. In this time period, the Earth’s surface had increased its temperature by 0.85 degrees Celsius (°C). The number of cold days and nights have decreased, and inversely, the number of warm days and nights have increased. Throughout parts of Europe, Asia, and Australia, we’ve also reported an increase in the number of heat waves. Also, in parts of Europe and North America, the amount and intensity of precipitation has also increased.
The Earth’s surface and the atmosphere aren’t the only places that are being warmed. The oceans have also started to notice an increase in temperature in the upper most portion. The largest observable increase in temperature of the ocean has occured within the first 75 meters (m) of depth where there has been an increase of 0.11°C per decade from 1971 to 2010.
5
Warming temperatures have given rise to increased melting of the cryosphere. Over the last two decades, the ice sheets around Greenland and Antarctica have lost mass, glaciers have decreased in size, spring snow cover in the arctic sea and Northern hemisphere have decreased, and permafrost temperatures in parts of Northern Alaska and Russia have increased.
6
When considering glaciers between 1971 and 2009, an average of 226 gigaton (Gt) of ice was lost per year. Within that forty eight year span, the ice melt fluctuated greatly. Looking at the period between 1993 and 2009, still within that same forty eight year span, but toward the end of it, it can be observed that an average of 275 Gt of ice melted from glaciers per year. Using this data, it can be concluded that as time went on, the impact by humans had increased the loss rate glacial ice. To understand how much ice is being lost each year, 1 Gt of ice is roughly equivalent to 1 square kilometer (km
3
). Thus, by the end of 2009, approximately 275km
3
of ice is being lost each year.
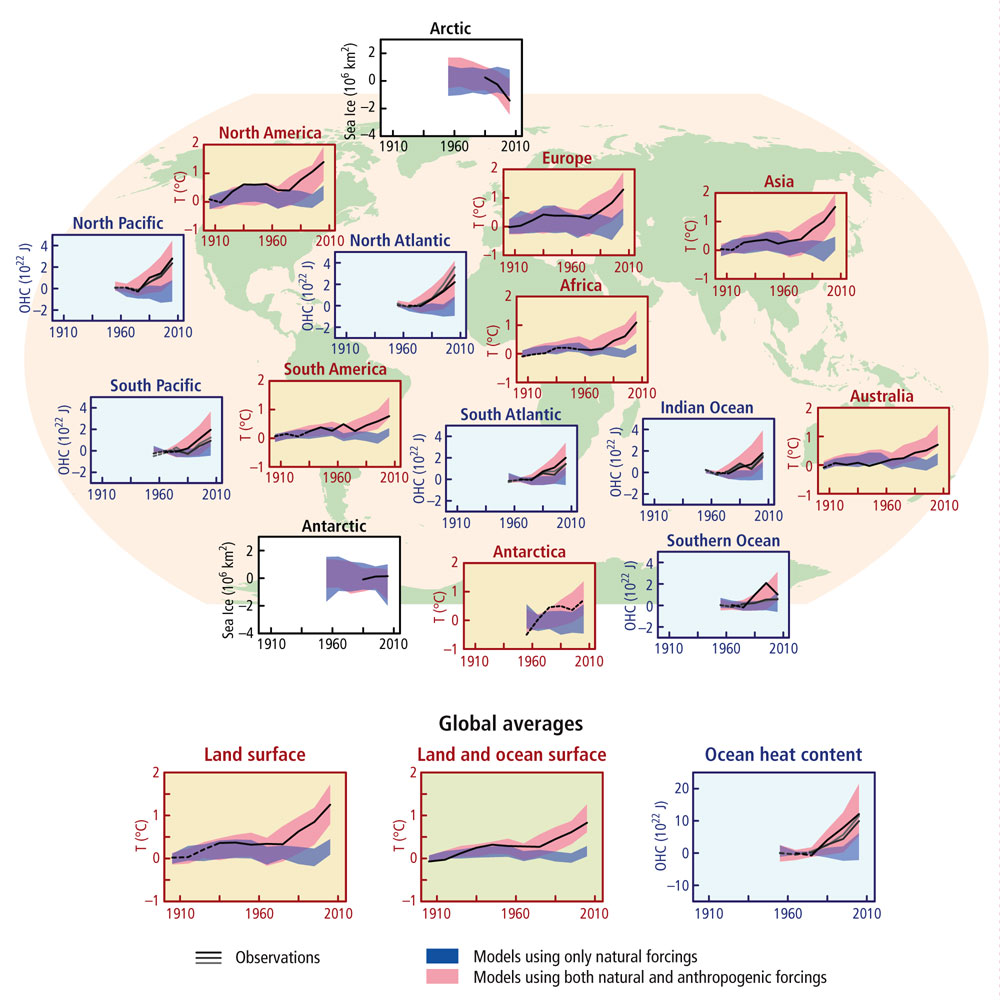
Figure 2: Comparison of observed and simulated climate change based on three large-scale indicators in the atmosphere, the cryosphere and the ocean: change in continental land surface air temperatures (yellow panels), Arctic and Antarctic September sea ice extent (white panels), and upper ocean heat content in the major ocean basins (blue panels). Global average changes are also given. Anomalies are given relative to 1880–1919 for surface temperatures, 1960–1980 for ocean heat content and 1979–1999 for sea ice. All time-series are decadal averages, plotted at the centre of the decade. For temperature panels, observations are dashed lines if the spatial coverage of areas being examined is below 50%. For ocean heat content and sea ice panels the solid line is where the coverage of data is good and higher in quality, and the dashed line is where the data coverage is only adequate, and thus, uncertainty is larger. Model results shown are Coupled Model Intercomparison Project Phase 5 (CMIP5) multi-model ensemble ranges, with shaded bands indicating the 5 to 95% confidence intervals. For further technical details, including region definitions see the Technical Summary Supplementary Material. {Figure 10.21; Figure TS.12} (IPCC, 2013).
The rate in which sea level rising has increased to a higher rate in over two millennia. Between 1901 and 2010, global sea rose about 0.19m. In that entire span of 1901 to 2010, the sea level rose about 1.7 millimeters (mm) per year, but looking at different periods during that one hundred and nine year span, the average rise of the sea level increased the closer we get to the present day. The span between 1971 and 2010, the sea level rose an average of 2.0 mm per year and the span between 1993 and 2010, there was an average increase of 3.2 mm per year. Since there is such a lower average when looking at the span of over one hundred years as opposed to just a span of almost twenty years, it indicates that the sea level is rising much faster in the present day.
The cause of the sea level rise can be attributed to glacial ice melt and water thermal expansion. Approximately 75% of the rising seas levels can be attributed to glacier mass loss and through thermal expansion due to temperature increases. As the glaciers melt, the water that was once frozen and attached to it, enters the ocean and adds more to its volume. This melting of the ice has raised sea levels by 0.76 mm per year. The other large contributing factor is the warming of the oceans. As water warms, it increases the volume. The same phenomenon can be seen in mercury thermometers. As the mercury warms, it expands and the top level rises. Beyond warming water and glacial melting, the other factor that has increased the sea level is land water storage (0.38 mm per year).
With more greenhouse gases in the atmosphere, a positive radiative forcing (RF) has been observed (Figure 3). Radiative forcing quantifies the amount of energy entering earth and leaving earth. A positive RF would indicate a warming and a negative RF would indicate a cooling. For the most part, our planet is undergoing a positive RF. Scientists have been able to record the amount of energy coming from the sun, by the use of satellites in orbit around the planet, and have come to a conclusion that the energy from the sun has not significantly changed to the point where that would increase the radiative forcing. The only other option that would cause our planet to continue to warm would be due to the planet not emitting as much energy into space as it used to. This is due to the energy becoming trapped by the different gases in the atmosphere. The total RF due to human interference in 2011 was 2.29 watt per square meter (W/m
2
). Some halocarbons and short-lived gases contribute to the RF, but the majority of the RF can be contributed to carbon dioxide emissions that caused an RF of 1.68 W/m
2
and methane caused an RF of 0.97 W/m
2
Cumulatively, all of the contributing RF is greater than 2.29 W/m
2
, but some emissions have been linked to lowering RF, like aerosols from volcanic activity and solar irradiance (Figure 4). Small global eruptions from volcanos can contribute to -0.11 W/m
2
and cloud adjustments caused -0.9 W/m
2
. Overall, even though there are natural factors that lead to a negative RF, human derived atmospheric drivers cause RF to be positive.
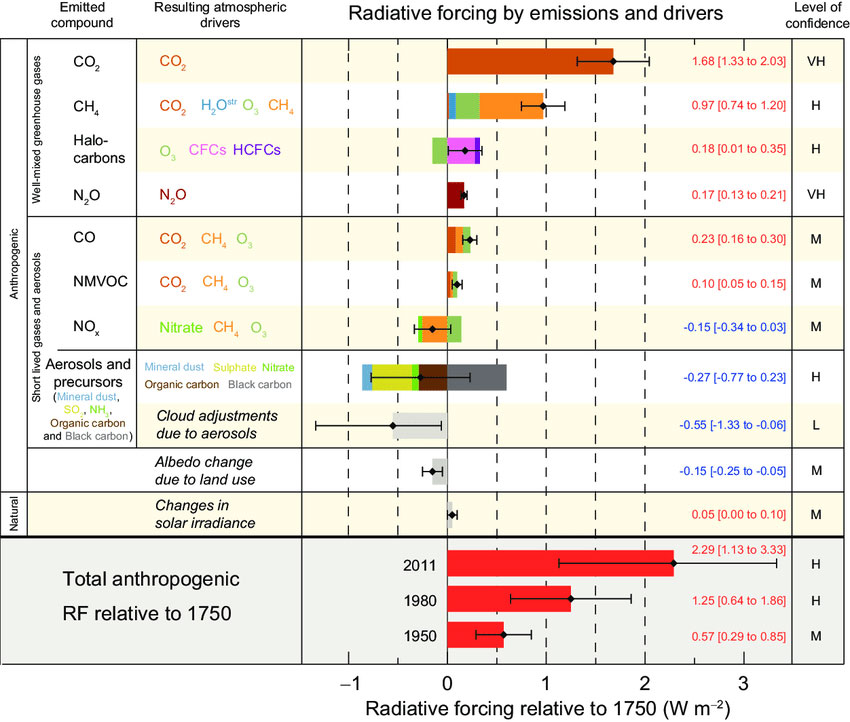
Figure 3: Radiative forcing estimates in 2011 relative to 1750 and aggregated uncertainties for the main drivers of climate change. Values are global average radiative forcing (RF14), partitioned according to the emitted compounds or processes that result in a combination of drivers. The best estimates of the net radiative forcing are shown as black diamonds with corresponding uncertainty intervals; the numerical values are provided on the right of the figure, together with the confidence level in the net forcing (VH – very high, H – high, M – medium, L – low, VL – very low). Albedo forcing due to black carbon on snow and ice is included in the black carbon aerosol bar. Small forcings due to contrails (0.05 W m–2, including contrail induced cirrus), and HFCs, PFCs and SF6 (total 0.03 W m–2) are not shown. Concentration-based RFs for gases can be obtained by summing the like-coloured bars. Volcanic forcing is not included as its episodic nature makes is difficult to compare to other forcing mechanisms. Total anthropogenic radiative forcing is provided for three different years relative to 1750. For further technical details, including uncertainty ranges associated with individual components and processes, see the Technical Summary Supplementary Material. {8.5; Figures 8.14–8.18; Figures TS.6 and TS.7} (IPCC, 2013).
It is evident that humans have caused an increase greenhouse gas emissions which has caused an increase of radiative forcing. An increase of radiative forcing increases the warming of the atmosphere, surface, and oceans. An increase in temperature causes an increase in severe weather anomalies and increased ice melt. An increase of ice melt combined with an increase of temperature contributes to the increase of sea level rising.