Students will prepare visual, written, and oral presentations of their research question, hypotheses, data gathering, and conclusions about a pair of variables related to the theme of economy and/or the environment. They should include discussion of predictions using a linear model and extrapolation or interpolation.
The slideshow presentation will contain the following items: title, question(s) about the relationship of at least two different variables for at least two different populations, sample data sets about the relevant variables, sources of data, univariate graphical representation of data (some type of display of a frequency distribution), bivariate graphical display of the relationship between two variables. Each graphical display requires a verbal interpretation of the data. Finally, students have to answer their question about the relationship between two variables, or differences between two populations.
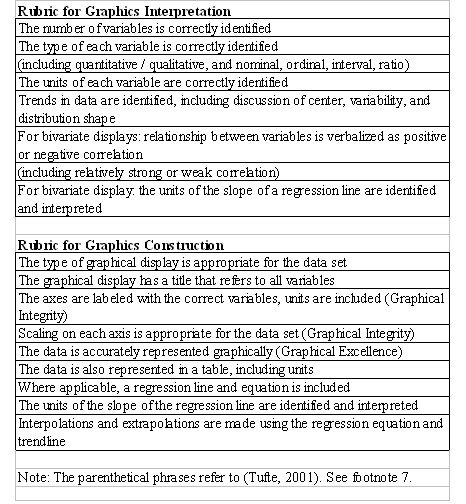
Figure 7 contains rubrics for both graphics interpretation and graphics creation that could be made more specific for each type of data display.
Figure 7
