Nicholas R. Perrone
In the
Are We Couch Potatoes or Busy Bees?
unit, students will follow the scientific method for the duration of this project. The scientific method will provide the basis for inquiry into the two main topics: data analysis/representation and physical health.
The project will begin with the students doing background research on child health, mainly physical activity; a possible additional topic could be the diet and its effect on health and well-being. This research will lead small groups of students to pick a question to analyze physical activity in the school setting. These questions may be derived from, but are not limited to, one of the following: stair climbing analysis measured in elevation as compared to a sky-rise building or mountain; distance traveled or number of steps walked measured on a map to show collective distance traveled from the school to a nearby city; inside versus outside classroom instruction; home free-time analysis of television, video game, or computer usage compared to amount of active play time; minutes doing Yoga compared to participants’ perceived stress level; length of instructional time between physical activities; and so on. Other topics may include analysis of diet while eating school breakfasts and lunches; however, diet is not the primary focus of this unit.
At the conclusion of this initial background research, small student groups will decide on a hypothesis statement. They will declare an educated prediction about what they expect will be the result of their research. For example, a group researching Yoga and how it may help reduce stress might hypothesize, “If we participate in Yoga every day, we will feel less stress.” During the experiment, the students could determine stress levels using survey data.
With their hypothesis in mind, the students will then begin testing their prediction. At this stage of the unit, students will need sufficient training on data collection through surveys, direct observations and measurements, and other means to get the information they need. The groups will carry out the entire data collection process including creating any surveys, observation tables, and/or measurement-reporting tables by other students.
When sufficient data are available, even if the data collection is ongoing, the students will begin to organize the data into structured tables. Each group will transfer this data onto a computer spreadsheet program that is familiar to the group. Training on the use of any preferred spreadsheet program is important for students to realize success. The organized data in table form will then be converted to various graphs. With the aid of the teacher and other students, if possible, the students will analyze their graphs in an effort to draw conclusions about what they discover. This previous step requires much guidance for the students since the bulk of the data analysis goes on during this stage.
Last, and arguably most important, is the reporting results stage. The student groups will take their graphs, typed conclusions, and any other pertinent artifacts from their project and create a working bulletin board or project board. The purpose of this board is to present their conclusion in a clear format to any person who reads it; therefore, they must tailor their graphs to fit what various age groups may be able to understand. For instance, a Kindergartener may not be able to understand what information might be identified on a double-bar graph, but he may be able to understand a pictograph version of that same information.
By the time each student group finishes, the students will have working boards to be able to present to their classes or even use in a science fair. Through the use of the Scientific Method, the students gain knowledge about data analysis and graphical representation, physical health and well-being, and scientific inquiry -- it is a fully integrated approach to learning.
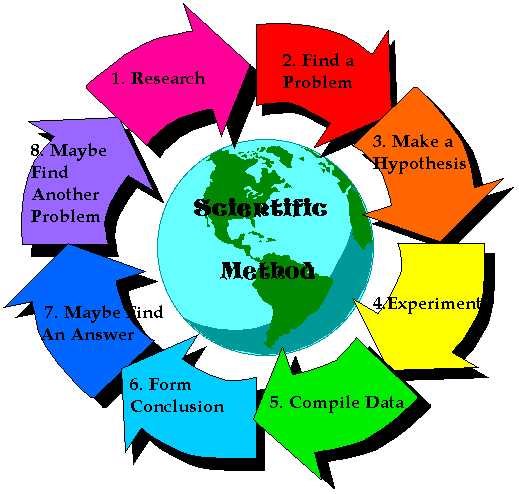
The Scientific Method:

Figure 1: Scientific Method diagram in cycle formula